FIGURE 3.
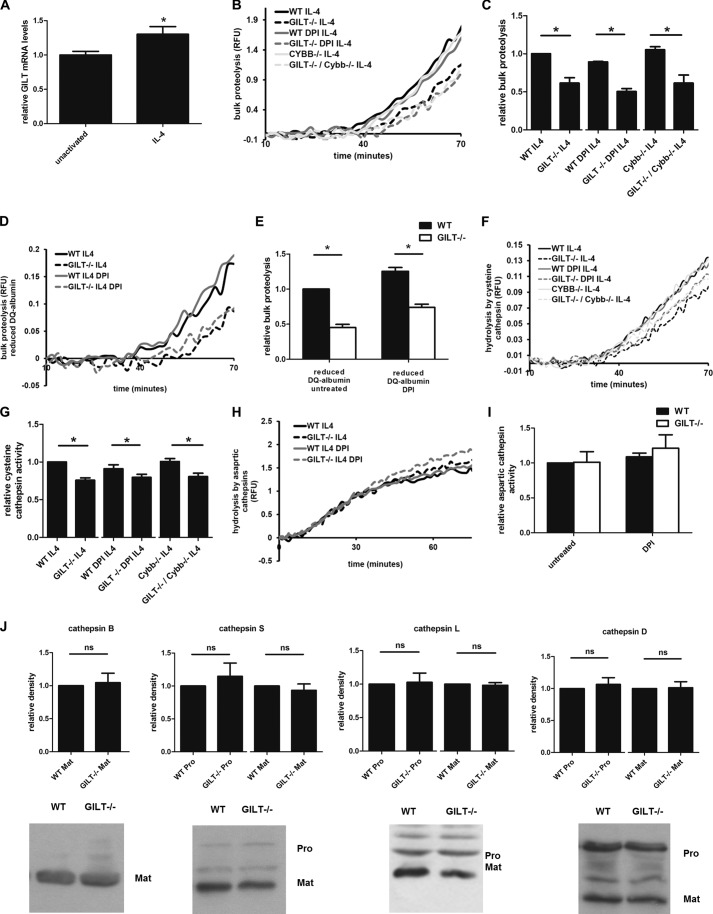
GILT−/− BMMØs display significantly lower rates of phagosomal proteolysis after IL-4-activation. BMMØs derived from WT, GILT−/−, Cybb−/−, and GILT−/−/Cybb−/− mice were incubated for 40 h in the presence 10 ng/ml IL-4. 10 min before the addition and subsequent phagocytosis of experimental particles, BMMØs were treated with the NOX2 inhibitor DPI (0.5 μm) where indicated. A, total mRNA levels of GILT in unactivated and IL-4-activated BMMØs were determined by QPCR. Averaged relative mRNA levels from four independent QPCR experiments are shown. Relative expression was expressed as mRNA levels relative to 18 S and presented relative to unactivated BMMØs. Error bars denote S.E. *, p < 0.05. RFU, relative fluorescence units. B and C, bulk proteolysis as measured by hydrolysis of the DQ-albumin substrate conjugated to experimental particles in IL-4-activated BMMØs (four independent experiments). D and E, bulk proteolysis as measured by hydrolysis of the prereduced and alkylated DQ-albumin substrate (four independent experiments). Reduced DQ-albumin was prepared by incubating experimental particles in 1 mm dithiothreitol followed by alkylation with 2 mm iodoacetic acid. F and G, phagosomal hydrolysis of the cysteine cathepsin-specific substrate (biotin-LC-Phe-Arg)2-rhodamine 110 conjugated to experimental particles in IL-4-activated BMMØs (seven independent experiments). H, and I, phagosomal hydrolysis of the aspartic cathepsin specific substrate in IL-4-activated BMMØs (four independent experiments). B, D, F, and H, representative real-time traces. Relative fluorescence values are proportional to the degree of substrate hydrolysis. C, E, G, and I, averaged rates relative to unactivated/untreated WT controls. Relative rates were calculated between 40–60 min after particle internalization. Error bars denote S.E. *, p < 0.05 as determined by paired t test of the indicated experimental groups. J, relative abundance of the lysosomal proteases in whole cell lysates of WT and GILT−/− IL-4-activated BMMØs as detected by semi-quantitative Western blotting. Mature (Mat) forms of cathepsins B, S, L, and D and the pro-forms (Pro) for cathepsins S, L, and D are shown. Representative images and averages of band relative density from four (cathepsins B and D), six (cathepsin S), and seven (cathepsin L) independent experiments are shown. Each calculated pixel volume was normalized to the calculated pixel volume of GAPDH expression from the same sample. Relative density was determined by calculation of normalized pixel volume relative to WT sample using Quantity One analysis software. Error bars denote S.E. ns, not significant.

