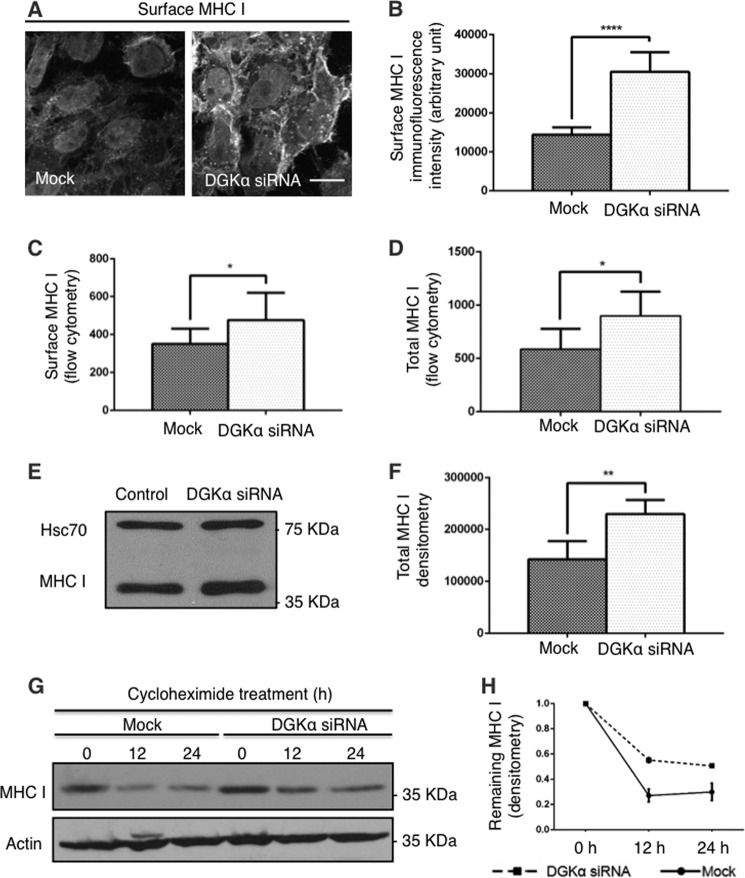
FIGURE 2.
DGKα controls the half-life of MHC I. A–C, surface level of MHC I for Mock and DGKα-knock-down cells was measured by immunofluorescence staining (A), and quantified by Image J in B and by flow cytometry (C). Briefly, Mock and DGKα knock-down cells were fixed and stained with anti-MHC I and secondary antibody in the absence of permeabilizing detergent. D–F, total cellular MHC I protein from Mock- and DGKα-depleted cells was measured by flow cytometry (D) with anti-MHC I and secondary antibody in the presence of saponin, and by immunoblotting (E; Hsc70 serves as a loading control). F, graph depicts densitometry analysis of three independent experiments as in E. G, 150 μg/ml cycloheximide was applied to HeLa cells for 0, 12, and 24 h prior to lysis. Immunoblotting of total cellular MHC I protein was done with anti-MHCI antibody. H, densitometry analysis of three independent experiments as in G is shown with standard deviation. *, p < 0.05; **, p < 0.0025; ****, p < 0.0001. Bar, 10 μm.

