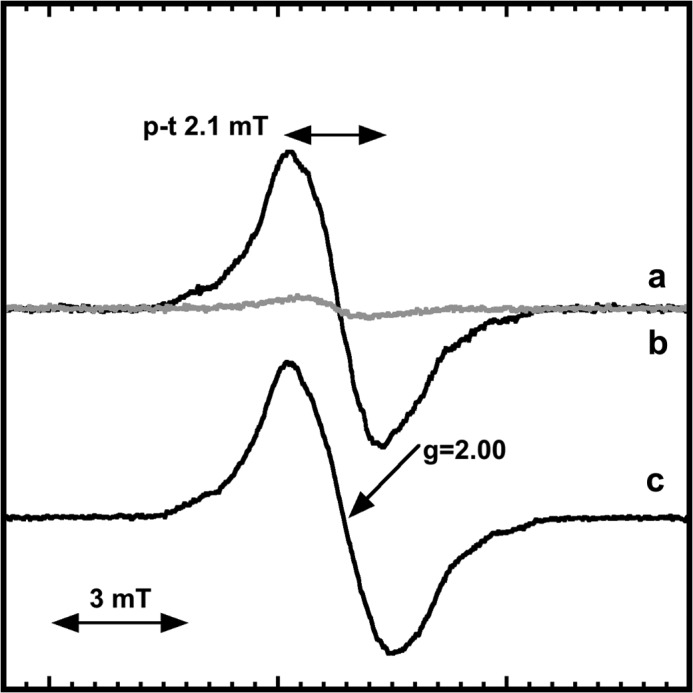
FIGURE 3.

X-band EPR spectra of B. anthracis NrdIsqin vivo and in vitro. In vivo EPR recorded on a frozen cell pellet obtained prior to IPTG addition (a); and following 4 h overexpression of NrdI in E. coli (b); NrdIsq generated in vitro through dithionite reduction (c). The spectra were recorded at 98K under non-saturating conditions. In a and b recording conditions were identical, (c) has been scaled to the same signal amplitude as for NrdIsq in b for comparison.
