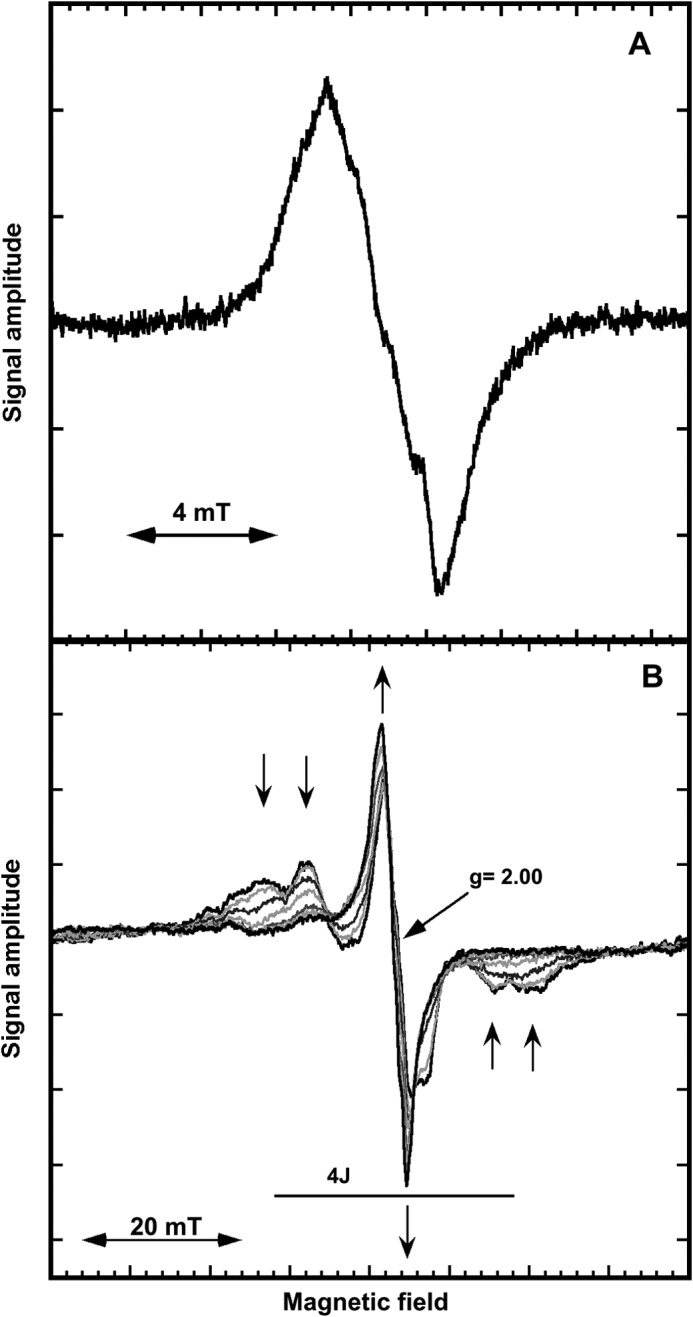
FIGURE 4.

X-band EPR spectra of B. anthracis MnIII2-Y·-NrdF at 77K (A) and in the temperature interval T = 6.7 to 40 K (T = 6.7, 10, 14, 20, 25, 35, and 40 K) (B). Arrows in Fig. 4B indicate the temperature dependence at the five lines of the “split tyrosyl radical” with increasing temperature. Recording conditions: modulation amplitude, 0.5 mT; 4 scans; microwave power was 10 milliwatt in A and 20 milliwatt in B.
