
FIGURE 5.
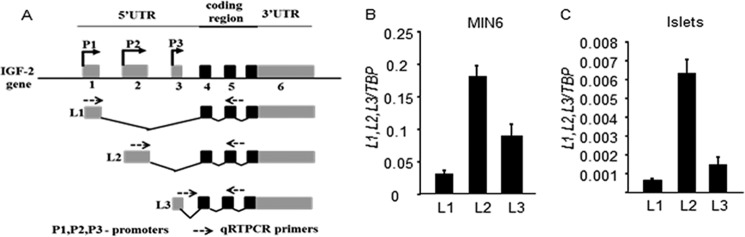
Differential usage of igf2 leader sequences in MIN6 cells and mouse islets. A, schematic drawing of the mouse igf2 gene; gray, noncoding exons; black, coding exons. The three promoters (P1–3) controlling expression of the leader sequences L1–3 are indicated as well as the primers used for quantitative RT-PCR analysis. Shown is a quantitative analysis of the expression of each leader-containing igf2 mRNA in MIN6 cells (B) and in primary mouse islets (C). The data are the means ± S.D. from three independent experiments.