FIGURE 2.
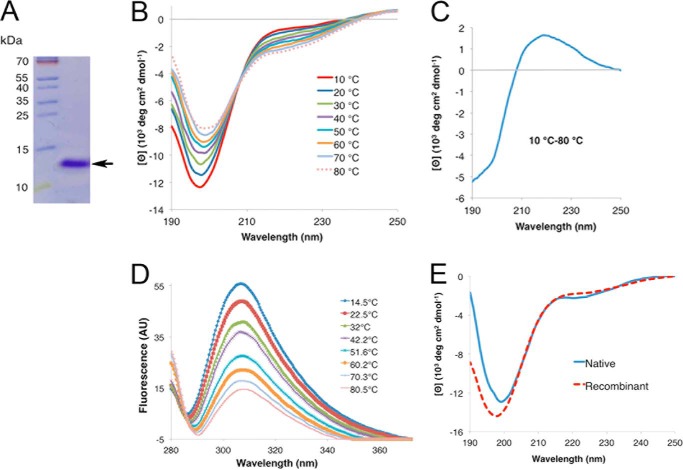
Circular dichroism spectroscopy analysis of rPvLEA6 protein. A, separation by SDS-PAGE of the purified rPvLEA6 protein used in these analyses. Molecular mass markers are shown to the left of the figure in kDa. B, CD spectra showing the effect of temperature on the secondary structure of rPvLEA6. C, CD difference spectrum obtained subtracting the CD spectrum at 80 °C from the CD spectrum at 10 °C (10–80 °C). D, rPvLEA6 protein analyzed by UV fluorescence showing the Tyr residue emission spectra obtained at different temperatures. The maximum emission fluorescence of Tyr residues occurs at 307 nm. AU, arbitrary units. E, CD spectrum of the native PvLEA6 protein obtained from dry common bean embryos compared with that from rPvLEA6 protein. Proteins were in 10 mm potassium phosphate buffer, pH 8.0.

