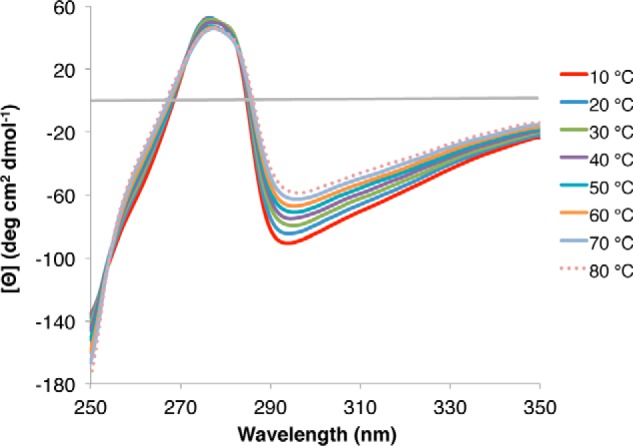
FIGURE 3.

Near-UV circular dichroism spectroscopy analysis of rPvLEA6 protein. Near-UV CD spectra showing the effect of different temperatures (10–80 °C) on rPvLEA6 secondary structure. CD spectrum in this UV region is attributable to phenylalanine (250–270 nm), tyrosine (270–290 nm), and tryptophan residues (280–300 nm), and thus changes in the local environment of these amino acids could be detected.
