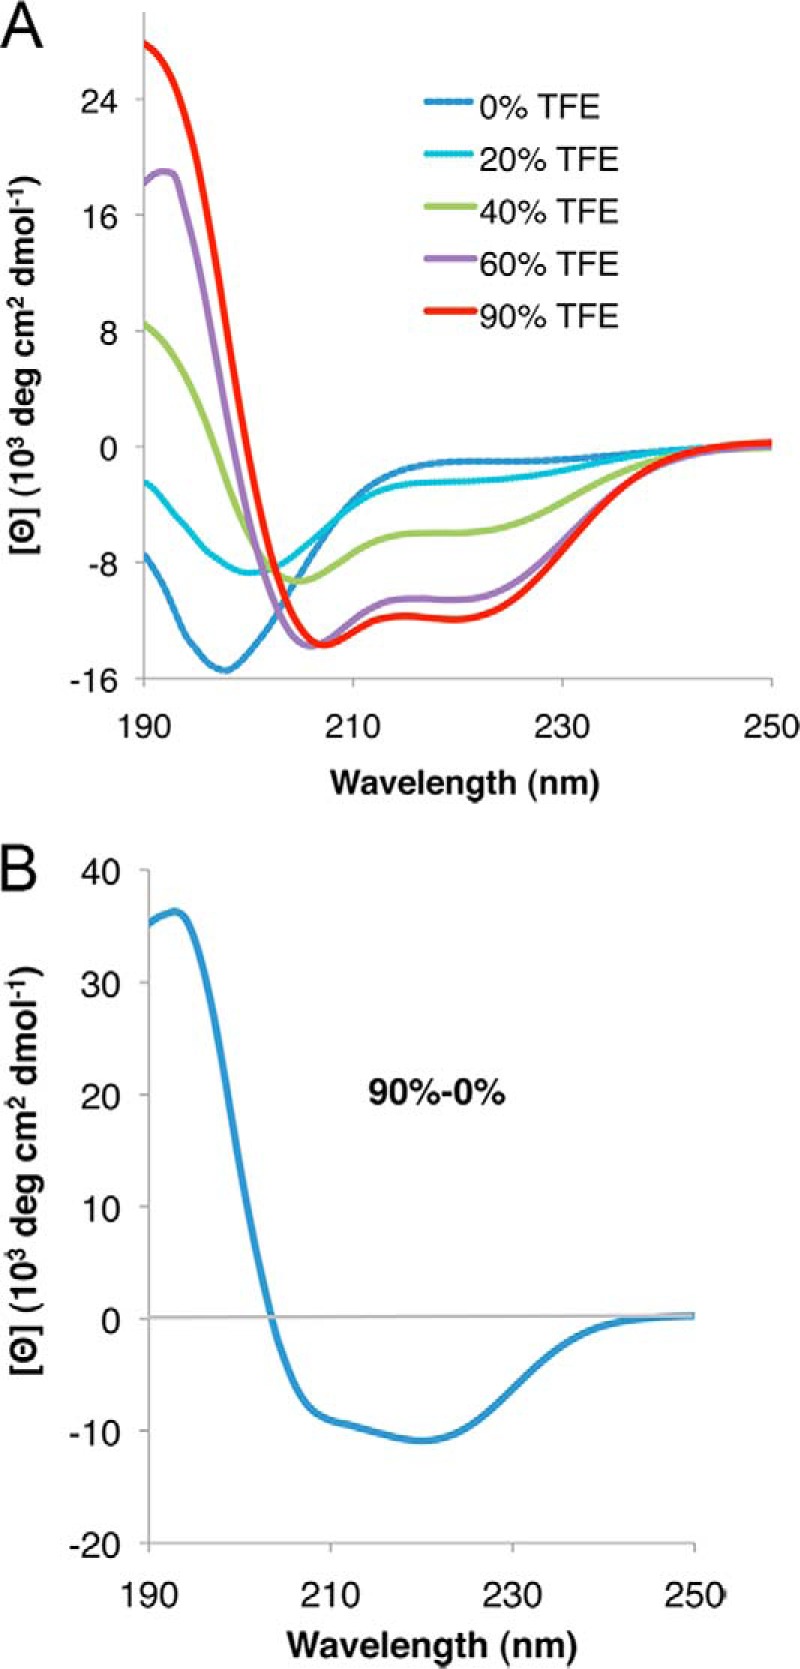
FIGURE 4.

rPvLEA6 protein analyzed by CD spectroscopy in the presence of TFE. A, CD spectra of rPvLEA6 protein in the presence of different concentrations of TFE (0–90%). B, CD difference spectrum obtained by subtracting the CD spectrum obtained at 0% TFE from the CD spectrum obtained at 90% TFE (90 to 0%).
