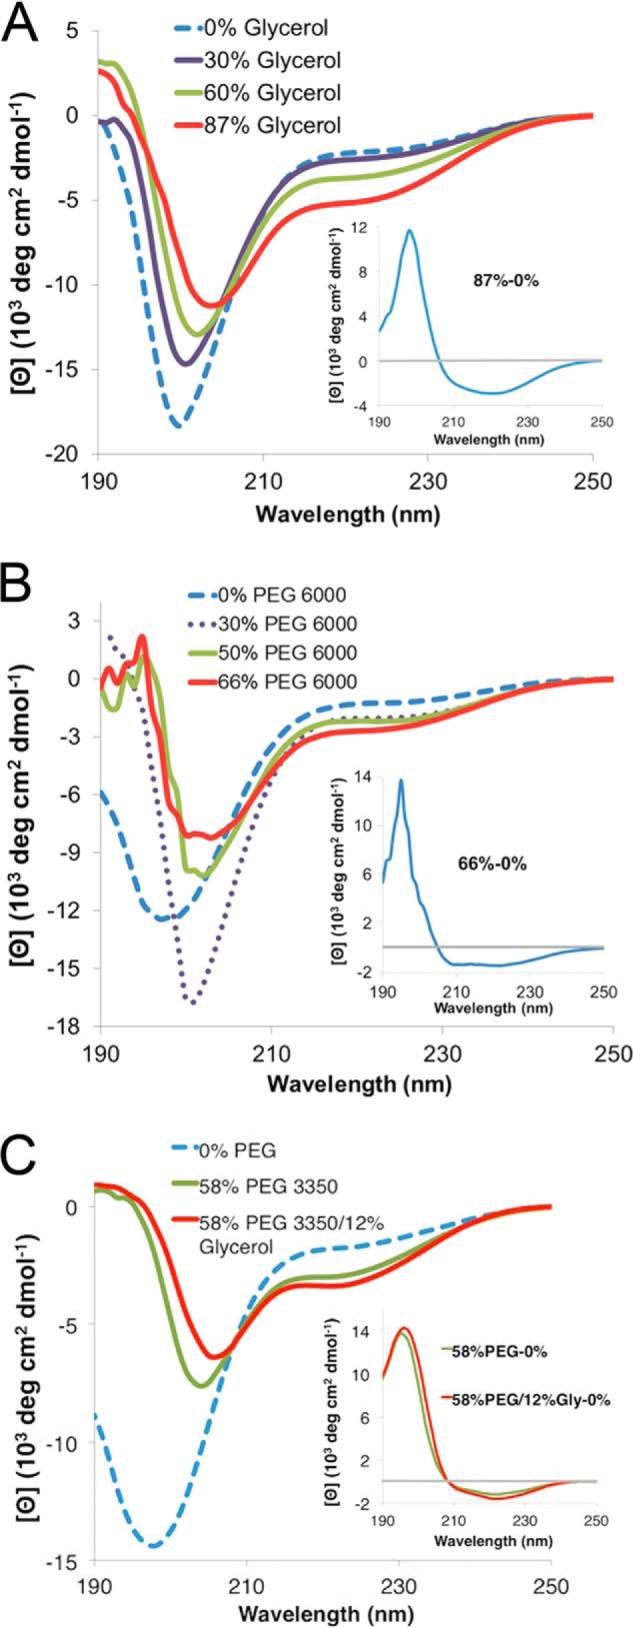
FIGURE 6.

Effect of high osmolarity and molecular crowding on rPvLEA6 protein secondary structure. A, CD spectra in the presence of different glycerol concentrations (0–87%). Inset, CD difference spectrum obtained by subtracting the CD spectrum obtained at 0% glycerol from the CD spectrum obtained at 87% glycerol (87 to 0%). B, CD spectra in the presence of different PEG-6000 concentrations (0–66%). Inset, CD difference spectrum obtained by subtracting the CD spectrum obtained at 0% PEG-6000 from the CD spectrum obtained at 66% PEG-6000 (66 to 0%). C, CD spectra in the presence of PEG-3350 (58%) or PEG-3350 (58%) plus glycerol (12%). Inset, CD difference spectra obtained by subtracting the CD spectrum at 0% PEG-3350 from the CD spectrum obtained at 58% PEG-3350 (58 to 0%) or by subtracting the CD spectrum at 0% solutes from the CD spectrum obtained at 58% PEG-3350 plus 12% glycerol (58/12 to 0%).
