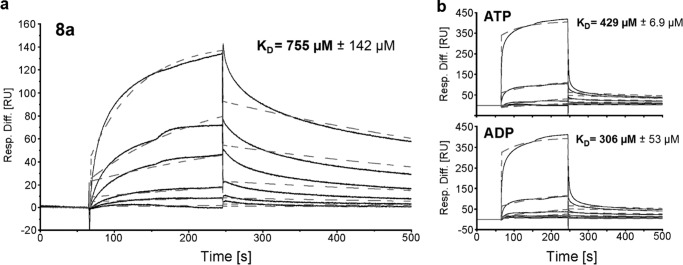
FIGURE 8.

2-Acetylamino-2-deoxy-3-O-methyl-d-mannose (8a), ATP, and ADP binding to MNK. In a, a representative sensorgram of 8a binding to MNK is depicted. The analyte was injected in a 3-fold dilution series starting from 5 mm. Representative sensorgrams of ATP and ADP binding to MNK are shown in b. The analytes were injected in a 2-fold dilution series starting from 6.25 mm. Obtained data (solid lines) was fitted using a 1:1 Langmuir binding model (dashed lines) and was calculated. Depicted KD values represent means and S.D. of three independent experiments (n = 3). Resp. Diff., response difference; RU, response units.
