
FIGURE 8.
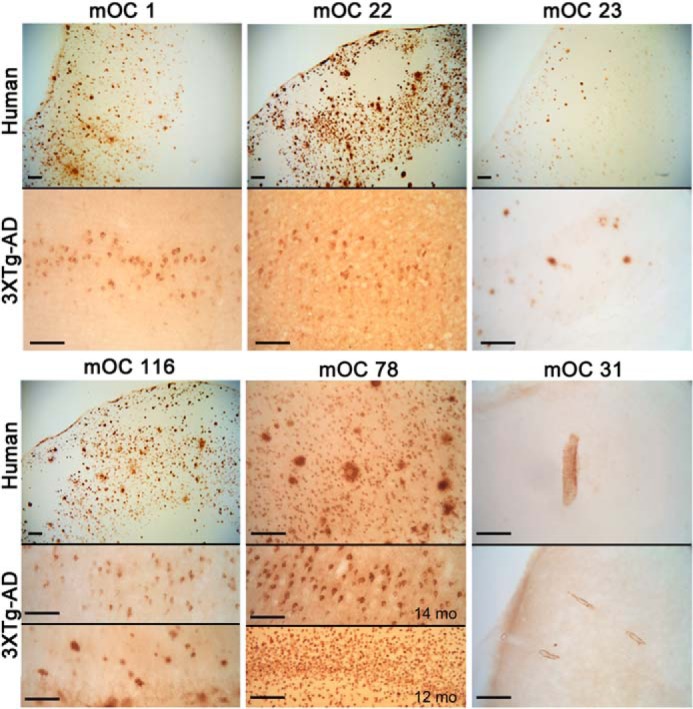
Differential staining of human AD and 3×Tg-AD mouse brain. Sections were stained with the indicated mOC antibodies. Top panels, human AD brain. Bottom panels, 14-month-old 3×Tg-AD mouse brain, except as indicated. Bars, 100 μm.
Official websites use .gov
A
.gov website belongs to an official
government organization in the United States.
Secure .gov websites use HTTPS
A lock (
) or https:// means you've safely
connected to the .gov website. Share sensitive
information only on official, secure websites.
Differential staining of human AD and 3×Tg-AD mouse brain. Sections were stained with the indicated mOC antibodies. Top panels, human AD brain. Bottom panels, 14-month-old 3×Tg-AD mouse brain, except as indicated. Bars, 100 μm.