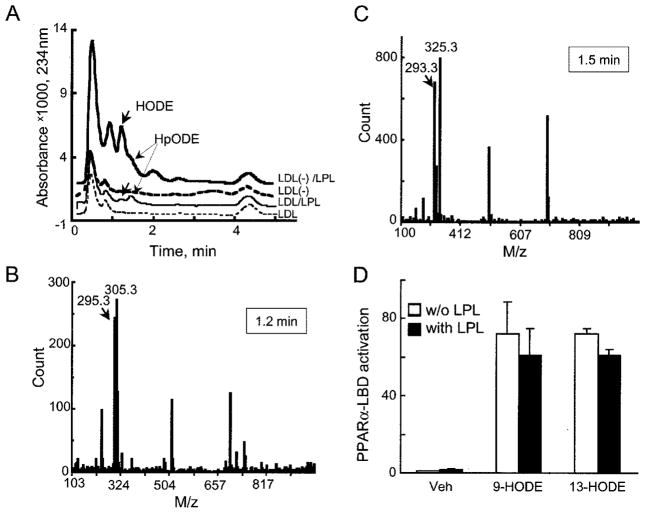
Fig. 5. LPL treatment of LDL(−) increases concentrations of oxidized linoleic acid products HpODE and HODE at levels sufficient to activate PPARα-LBD.
A, HPLC-UV chromatograms of lipophylic extracts obtained from LDL (thin line) and LDL(−) (bold line) before (dashed lines) and after (solid lines) LPL treatment (200 units/ml, 2 h, 37 °C) are shown. The release of HODE (bold arrows) and HpODE (thin arrows) were identified by mass spectrometric analysis as shown in panels B and C. The HODE and HpODE release concentrations are 1.2 μg per 100 μg of LDL(−). The analysis does not discriminate between 9- and 13-HODE isomers. B, mass spectrometry for [M–H]− ion for HODE (arrow) is shown at its respective retention time as indicated in the box. C, a similar mass spectrometric analysis is shown for the [M-H3O]− ion for HpODE. D, PPARα LBD activation of BAECs (as in Fig. 3A) stimulated with 1.2 μg of HODE isomer per well without (open bars) or with LPL (black bars) is shown. Similar PPAR activation is seen with either the 9- or the 13-HODE isoform. These responses equaled those seen with the synthetic PPARα activator WY14643 (100 μM, 68 ± 5-fold). Veh, vehicle.

