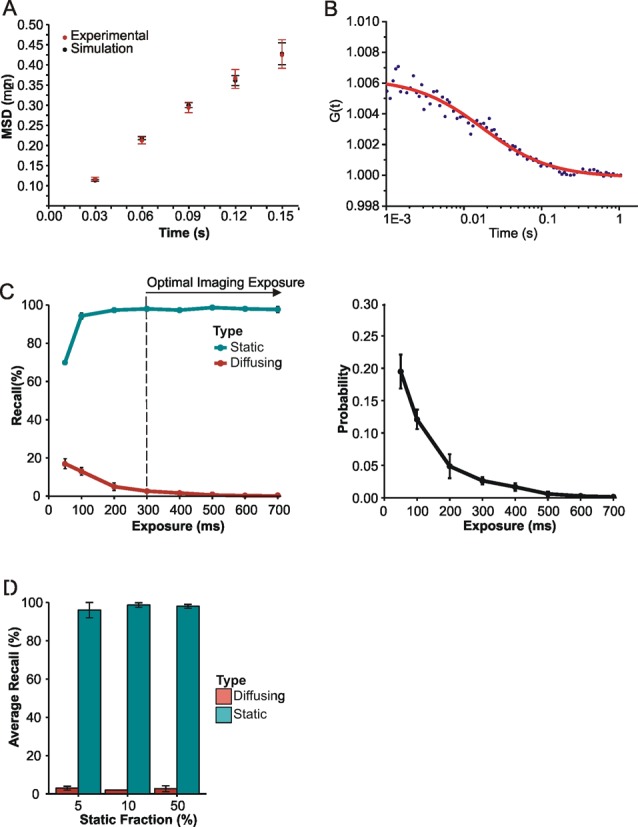
Figure 2.

Simulating nuclear protein diffusion to optimize exposure time. (A) Mean square displacement (+/− SE) of Mcm4-mEos3.1 proteins (Red). Linear fitting of the first four points of the curve leads to the determination of an apparent diffusion coefficient (D* = 0.7 μm2/s) that is underestimated because proteins diffuse in three dimension inside the nucleus. Simulations of 2D mean squared displacements from 3D diffusing molecules inside a sphere of radius 1 μm were performed for diffusion coefficients ranging from 1.5 to 2 μm2/s (n > 1000 tracks per simulation). The best correspondence was obtained for D = 1.7 ± 0.3 μm2/s (Black). (B) Representative FCS curve obtained in vivo in S. pombe cells with Mcm4 tagged with eGFP. FCS experiments were performed in the nuclei of four different cells, leading to an average diffusion coefficient of 1.6 ± 0.4 μm2/s. (C) Diffusing (diffusion coefficient = 1.7 μm2/s) and static molecules were simulated with different exposure times and processed using our super-resolution fitting routines. The percentage recall of simulated molecules was determined by comparing simulation and Gaussian-fitted data sets. Error bars represent standard deviation calculated from three repeats. Recall percentages from simulations were used to estimate the probability of detecting diffusing rather than static molecules at different exposure times (diffusing/(diffusing+static)). Error bars represent standard deviations from three experiments. (D) Average recall analysis of mixed populations of simulated molecules at the optimal exposure time. The percentage of static molecules was altered to observe any effect of a higher proportion of diffusing species on recall of static molecules at 350-ms exposure time. Error bars represent standard deviation calculated from three independent repeats.
