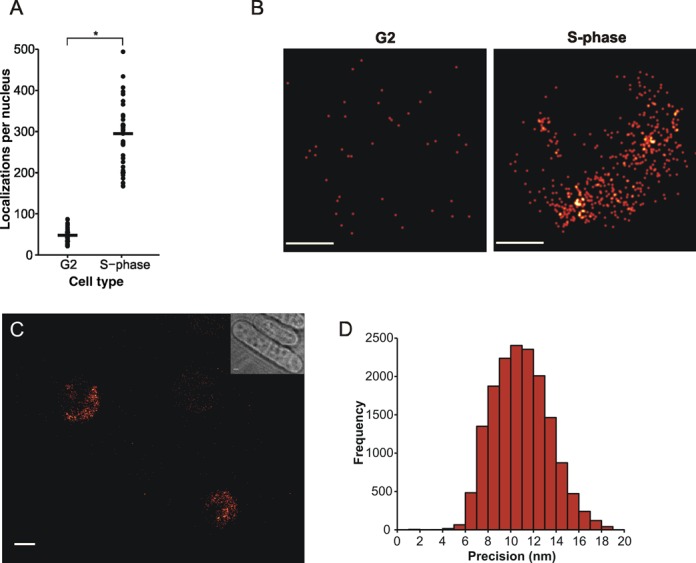
Figure 3.

Visualization of DNA-bound Mcm4 in fission yeast. (A) Numbers of Mcm4-mEos3.1 fluorescent localizations per nucleus for both G2 and S-phase cells imaged at 350-ms exposure time using continuous wave (CW) activation. Raw data were processed with 2D-Gaussian fitting routines to score total localizations. G2 cells (n = 36) were harvested from lactose gradients and either directly imaged or cultured in YE media + 10-mM HU for 120 min to obtain S-phase cells (n = 39). Black solid line indicates median value (G2 = 47, S-phase = 295) *P = 1.5 × 10⁻²¹. (B) Typical Mcm4-mEos3.1 reconstructed nuclear localization patterns in both G2 and S-phase cells. Reconstructed PSFs were plotted with an experimental average width of 11 nm, the calculated average accuracy. Scale bar represents 0.5 μm. (C) Reconstructed localization image of G2 and S-phase fission yeast cells expressing Mcm4-mEos3.1. Cells were obtained from lactose gradient synchronization and the two cell types mixed and imaged on the same agarose pad. Similar localization patterning can be seen compared to when cell types were imaged separately. Scale bar represents 1 micron. (D) Representative histogram of mEos3.1 fluorescent localization precisions imaged at 350-ms exposure time (n = 16011, median = 10.83 nm).
