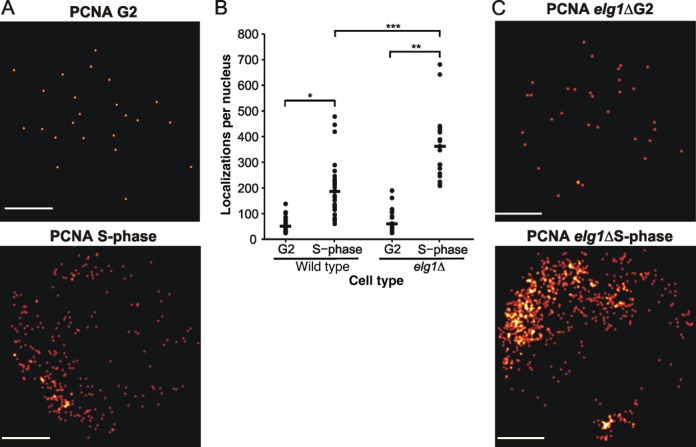
Figure 4.

Visualization of DNA-bound PCNA in fission yeast. (A) Representative reconstructed images of mEos3.1-PCNA nuclear localization patterns in S-phase and G2 S. pombe cells. (B) Numbers of mEos3.1-PCNA fluorescent localizations per nucleus in elg1+ and elg1Δ cells imaged with an exposure time of 350 ms in either G2 or S-phase cell cycle stages (n = 19, 26, 21 and 20 for elg1+ G2, elg1+ S-phase, elg1Δ G2 and elg1Δ S-phase, respectively). Cells were treated with sodium azide to prevent ATP-dependent PCNA DNA unloading/loading during imaging. Horizontal bar represents median value (elg1+ G2 = 51, elg1+ S-phase = 187, elg1Δ G2 = 60, elg1Δ S-phase = 362). P-value determined by two-tailed students T-test, *P = 8.1 × 10⁻⁷, **P = 9.4 × 10⁻¹⁰ ***P = 5.9 × 10⁻⁵. (C) Representative reconstructed images of elg1+ and elg1Δ mEos3.1-PCNA nuclear localization patterns in S-phase cells.
