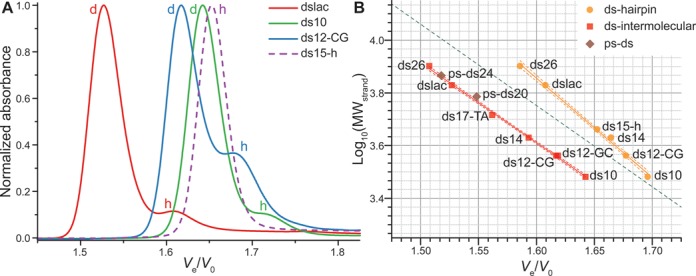
Figure 3.

(A) Normalized chromatograms of some auto-complementary oligonucleotides (plain lines), and the hairpin-forming ds15-h (dashed line). Dimeric species are indicated with a d, and hairpins with a h. Examples of data treatment are given in Supplementary Figure S2. Other chromatograms can be found in Supplementary Figures S7 and S8. (B) Predictive plot of the log10(MW) against Ve/V0 for duplex-forming oligonucleotides structured in intermolecular antiparallel duplex (red squares) and hairpin (orange circles). The two sets are linearly fitted independently (solid lines; dashed lines: 80% prediction bands). Parallel duplexes are shown as brown diamonds. The linear fit obtained for dTn oligonucleotides is depicted as a green dotted line.
