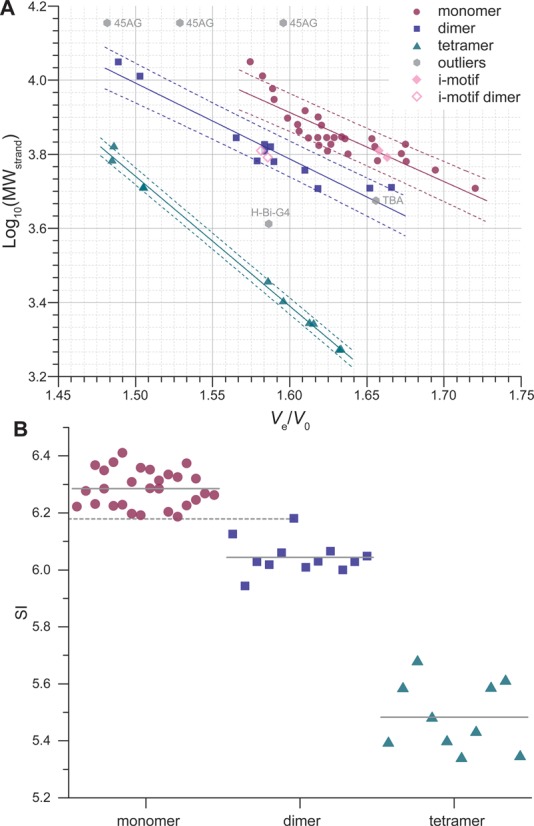
Figure 5.

(A) Predictive plot: log10(MWstrand) against Ve/V0 for quadruplex-forming oligonucleotides, with linear fitting (solid line; dashed lines: 80% prediction bands). Prediction bands define areas for each category of structures. Outliers are oligonucleotides whose particular structure (e.g. only two tetrads for TBA) leads to a non-alignment of its Ve/V0 with the ones of its structural category (e.g. other monomers). (B) SI chart obtained from the product of the MWstrand by Ve/V0; plain gray lines: mean values (monomers: 6.29 ± 0.06, dimers: 6.04 ± 0.06, tetramers: 5.48 ± 0.12), dashed gray line: maximum SI value observed for dimers (93del: 6.18).
