
Figure 2.
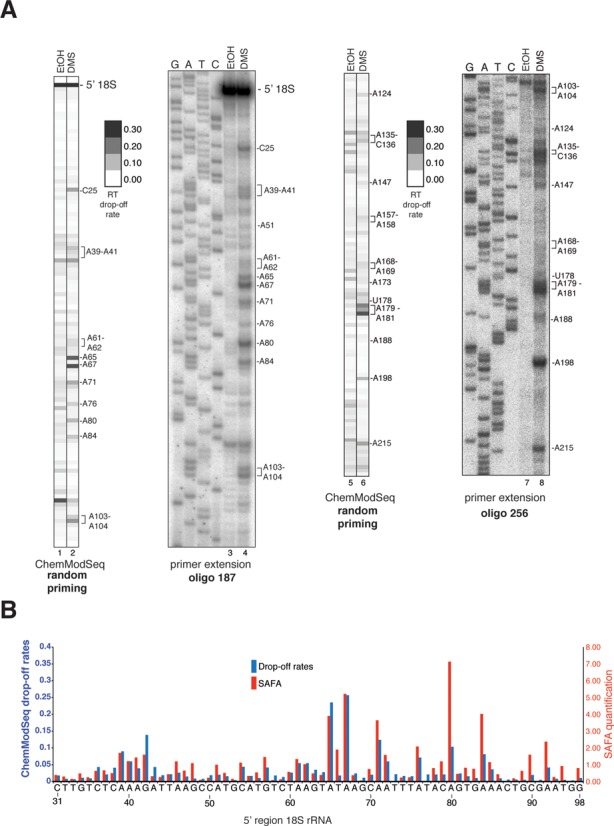
ChemModSeq accurately and quantitatively measures RNA secondary structure. (A) Primer extension results and ChemModSeq drop-off rates for DMS modified and unmodified 18S rRNA, focusing on the first ∼100 nucleotides. To compare ChemModSeq with primer extension data, drop-off rates were converted to gray scale heat maps in which each block represents a single nucleotide. The darker the color of the block, the higher the drop-off rate. Oligos used for primer extensions are indicated in bold (see Supplementary Table S4). The positions of the modified nucleotides are indicated on the right side of each panel. (B) ChemModSeq data agree well with primer extension results. Direct comparison of the primer extension results shown in (A), quantified using SAFA (34) (red bars) and ChemModSeq RT drop-off rates (blue bars) for the same region (nucleotides 31–98).