
Figure 3.
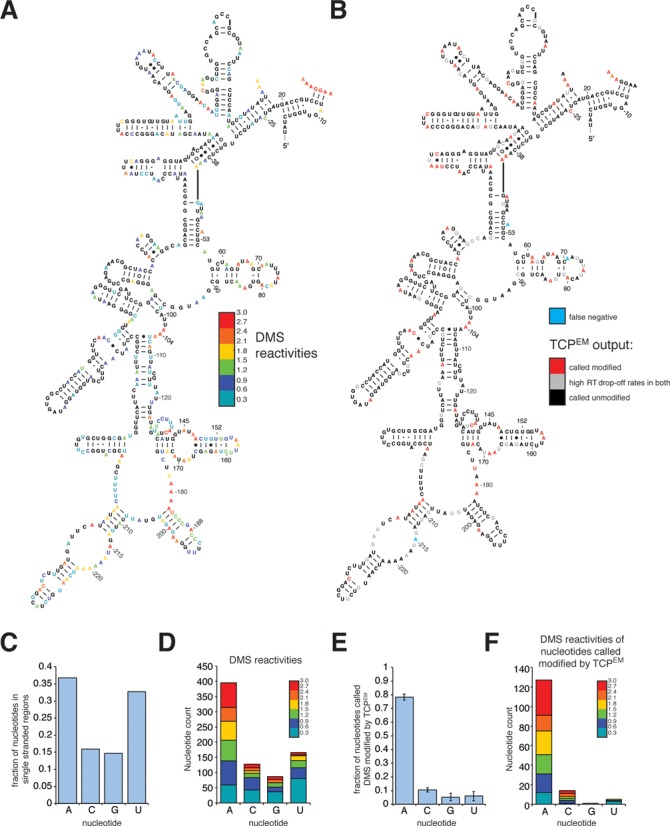
ChemModSeq accurately and quantitatively measures RNA secondary structure. (A and B) DMS reactivities (A) and TCPEM outputs (B) for nucleotides in the 18S rRNA depicted in the secondary structure of the 5′ region of the yeast 18S rRNA. DMS reactivities were calculated as described (31) and capped at 3. Red colored letters in (B) indicate nucleotides called modified by the TCPEM algorithm. Blue letters in (B) indicate nucleotides visually identified as modified by DMS in primer extension reactions (see Figure 2A) but not called modified by the TCPEM algorithm. (C and D) Distribution of nucleotides located in single-stranded regions in the 18S rRNA (C) and the distribution of nucleotides with DMS reactivities higher than zero (D). (E and F) Fraction of nucleotides called DMS-modified by the TCPEM algorithm (E; average and standard deviations from three independent experiments) and the DMS reactivities of these nucleotides (F). DMS reactivities were calculated by summing drop-off counts from three independent experiments.