
Figure 6.
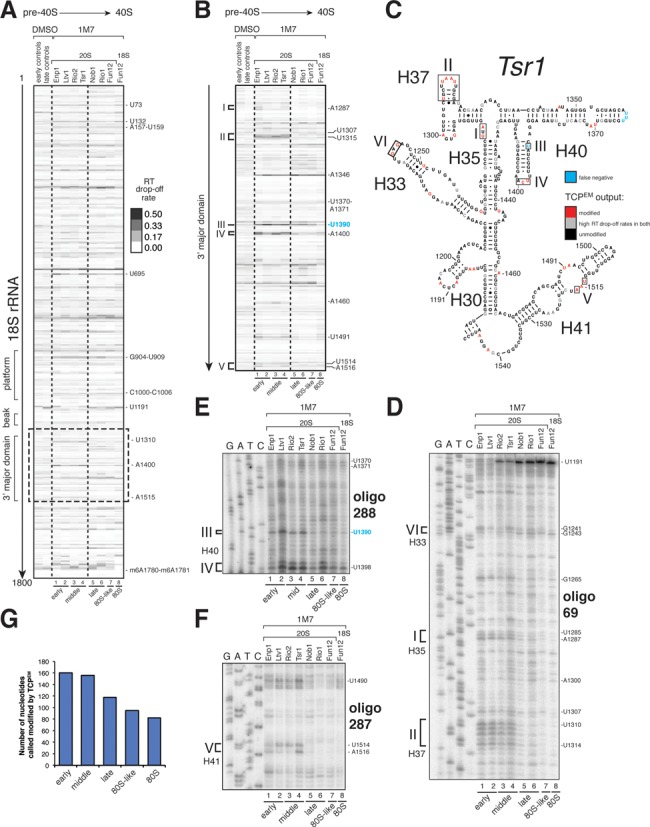
A digital snapshot of pre-rRNA secondary structures. (A and B) ChemModSeq and primer extension results obtained using rRNAs extracted from in vitro 1M7 modified particles. Heat maps of average RT drop-off rates in 18S coding sequences (n ≥ 2) (A) or the 3′ major domain (B) of purified rRNAs. The positions of the modified nucleotides are indicated on the right side of each panel. (C) Early-middle and late pre-40S particles are structurally distinct. The 3′ major domain secondary structure represents the ChemModSeq results for the middle (Tsr1) particle. Red nucleotides were indicated as modified by the TCPEM algorithm. Blue nucleotides were visibly modified by 1M7 but not called modified by the TCPEM algorithm (false negative). (D–F) Representative primer extension reactions for the 3′ major domain. Roman numbers indicate sites where differences in SHAPE reactivity were observed between pre-40S particles. Oligonucleotides used for primer extensions are indicated in bold. The positions of the modified nucleotides are indicated on the right side of each panel. (G) Pre-rRNAs in early and middle pre-40S complexes adopt more flexible conformations compared to late particles. Plotted are the average number of nucleotides called modified by the TCPEM algorithm (y-axis) for early, middle, late, 80S-like and mature 80S translation initiation complexes (x-axis).