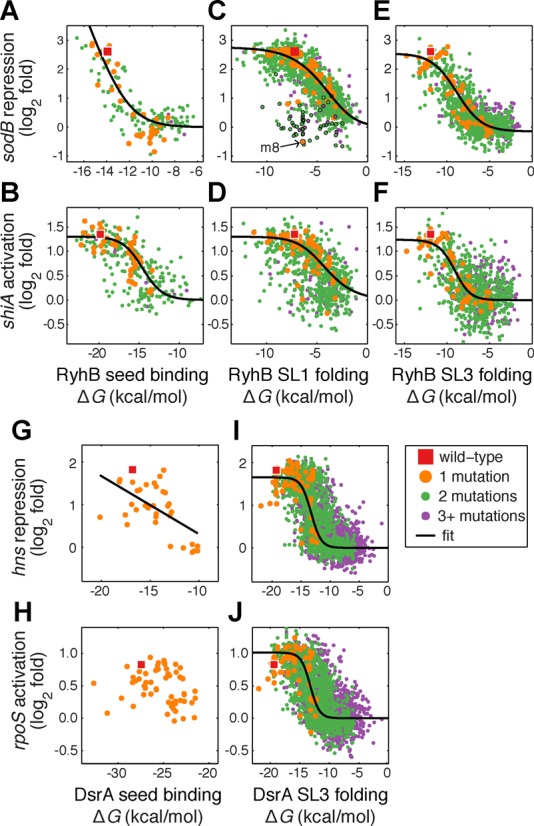
Figure 3.

Effects of RNA binding energy and structure stability on sRNA efficiency. For each sequence variant we compare the change in local RNA stability or target binding free energy (kcal/mol) to sRNA repression/activation of its targets. (A–F) Variants of RyhB, (G–J) variants of DsrA. Seed interactions (A, B, G–H) are modeled as binding free energy of the sRNA-mRNA duplex. (A) RyhB-sodB (R2 = 0.62, N = 158), (B) RyhB-shiA (R2 = 0.42, N = 277), (G) DsrA-hns (R2 = 0.37, N = 35), (H) DsrA-rpoS (N = 60). Stem loop stability (C–F, I, J) is modeled by self-folding free energy. Stability of RyhB SL1 compared with regulation of (C) sodB (R2 = 0.46, N = 1223) and (D) shiA (R2 = 0.13, N = 792); stability of RyhB SL3 and regulation of (E) sodB (R2 = 0.57, N = 1089) and (F) shiA (R2 = 0.26, N = 908); stability of DsrA SL3 and regulation of (I) hns (R2 = 0.43, N = 2746) and (J) rpoS (R2 = 0.33, N = 2655). Variants carrying the mutation A30G are outlined with black circles in panel (C), and an arrow indicates m8, the variant that carries this mutation alone.
