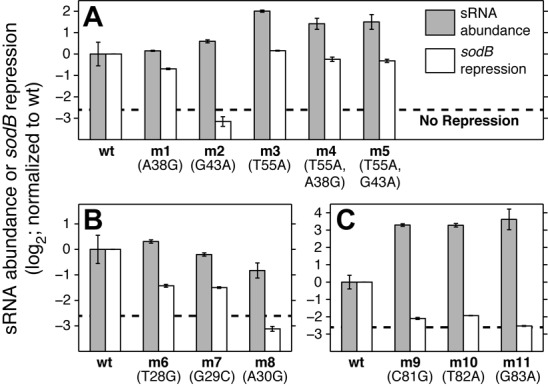
Figure 4.

Changes in sRNA abundance due to mutations. sRNA abundance for RyhB variants, measured by qPCR in absence of its exogenous targets (gray bars), plotted relative to the wild type. Error bars are standard errors of the mean. qSortSeq measurements of the change in sodB repression (white bars). (A) Sequences carrying mutations in the seed region for sodB (m1, m2), and a mutation that recovers efficiency for these seed mutations (m3, m4, m5); (B) mutations in the 5′ stem-loop, SL1; (C) mutations in the 3′ stem-loop, SL3.
