
Figure 6.
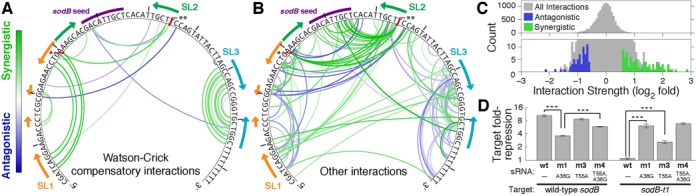
Mutation interactions for RyhB-sodB. Interactions are defined by deviations from the additive model for variants with two mutations compared to the wild-type. (A and B) Interaction maps for RyhB-sodB. The 150 most significant interactions (out of 11 910 pairs measured) are color-coded based on the strength and the ‘sign’ of the interaction, synergistic (green) or antagonistic (blue). RyhB sequence and the seed for sodB are annotated, and the secondary structure is marked by arrows indicating downstream and upstream pairing. The two single point mutations with the most interactions, A30G (*) and T55A (**), are marked. For clarity, compensatory interactions which maintain a potential Watson–Crick pairing lost by each mutation alone are plotted separately (A) from all other interactions (B). Eleven of the 21 compensatory interactions correspond to known stem-loop pairings in SL1 and SL3. (C) Histogram of IS, with mapped interactions highlighted in green (synergistic) and blue (antagonistic). (D) Seed-specificity assay: Fold-repression (log-scale) of two sodB variants, by wild-type RyhB and three sRNA variants, estimated from bulk GFP fluorescence measurements. ***P < 0.001 (two-tailed t-test).