Figure 2.

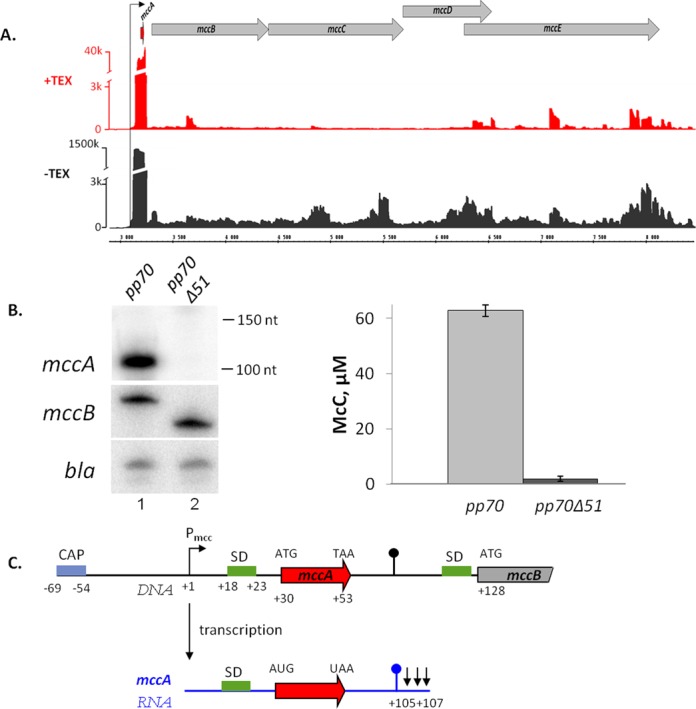
In vivo analysis of the mcc operon transcripts. (A) Analysis of the mccABCDE operon of E. coli using differential RNA-Seq. RNA was extracted from E. coli cells harboring the McC-production plasmid pp70 and grown to late exponential phase in LB medium. Half of RNA was treated with Terminator™ 5′-phosphate-dependent exonuclease (TEX) (+TEX), while another half was left untreated (−TEX) and then converted into a cDNA library, which was subjected to high-throughput Illumina sequencing. cDNA sequencing reads were aligned to the mcc operon and visualized as coverage plots representing the number of reads per nucleotide (‘k’ for thousands of reads) in the IGB (Affymetrix). In the IGB screenshot shown plasmid coordinates are indicated in the middle; gray arrow represent annotated ORFs, black arrow denotes Pmcc and the ORF of the small peptide mccA is shown as a red arrow. (B) At the left-hand side, results of detection of mcc transcripts in cells harboring the wild-type McC-production plasmid pp70 and its derivative pp70Δ51 harboring a deletion in the mccA–mccB region are shown: top—Northern blotting with an mccA-specific probe. Positions of Decade™ RNA Markers are indicated on the right. Middle—primer extension using a primer annealing at the beginning of the mccB gene. Bottom—primer extension using a primer annealing to plasmid-borne bla gene. At the right-hand side, the levels of McC production by cells harboring the wild-type or mutant McC-production plasmids and used for transcript analysis are shown. (C) Summary of mccA transcript mapping. A fragment of the mccABCDE operon DNA (in black) and the short mccA transcript (in blue) are schematically shown, arrows in the end of mccA transcript indicate results of 3′ end mapping by 3′-RACE. SD sequences of mccA and mccB ORFs are shown in green.
