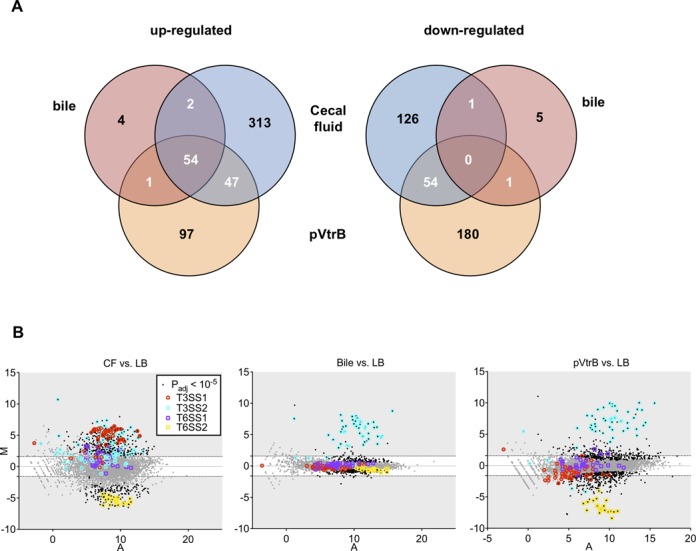
Figure 4.

Comparative analyses of the V. parahaemolyticus transcriptional response to intraintestinal growth, bile and VtrB overexpression. (A) Venn diagrams showing overlaps among genes with increased (left) or decreased (right) transcript abundance in response to the three conditions, relative to growth in LB. (B) MA plots depicting changes in gene expression for each condition, with genes of T3SS and T6SS highlighted.
