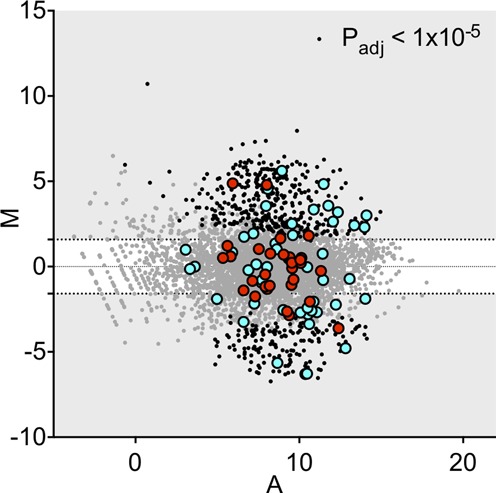
Figure 7.

MA plots of V. parahaemolyticus gene abundance in cecal fluid versus LB. The log2 of the ratio of abundances of each ORF between these two conditions (M) is plotted against the average log2 of abundance of that ORF in both conditions (A). M and A values are based on data from all biological replicates of each growth condition. Homologs of genes up- and down-regulated in V. cholerae are highlighted in blue and red, respectively.
