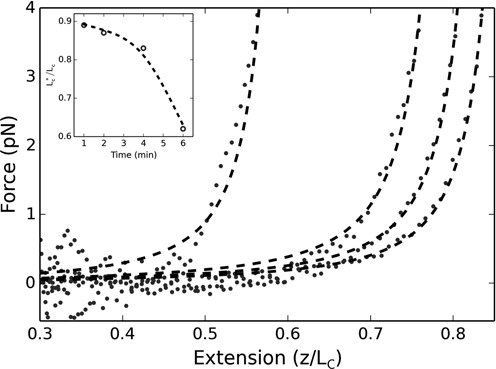
Figure 1.

Force-extension curves for 200 nM of H-NS and Hha. From right to left: 1, 2, 4 and 6 min after optically trapping/centering the attached microsphere. Dashed curves are WLC fits with variable DNA persistence and contour lengths. Inset: relative change in contour length obtained by the fits (dashed line is an interpolation).
