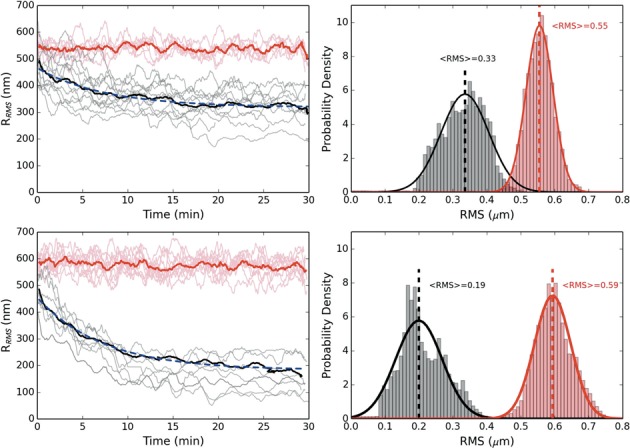
Figure 2.

Dynamics of DNA condensation after applied tension. The top (bottom) figure is for equal concentrations of H-NS and Hha of 100 (200) nM. The red curves are the control absent an force applied. The prominent solid lines are averaged over the respective trajectories and fitted by a decaying exponential (dashed/blue) (τ = 7.5 (7.3) min for 100 (200) nM protein). All trajectories have been smoothed by a 60 s running window. Top (bottom) right: RMS histograms for 100 (200) nM protein for control (red) and collapsed (black) population after 15 minutes. The trajectories were fitted to a Gaussian to provide a mean RMS value.
