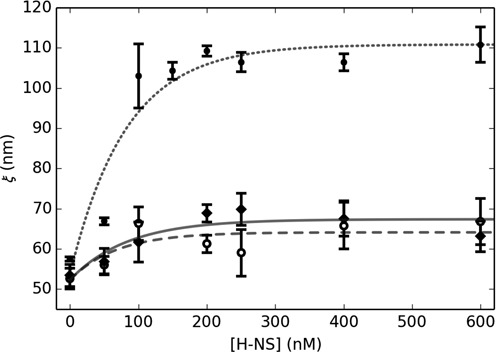
Figure 3.

Persistence length dependence upon H-NS concentration. Measured via TPM pre-stressed (circles/dotted line) and post stressed (open circles/dashed line). Measured via force extension with optical tweezers (diamonds/solid line). Exponential fits to the data (lines) provide a reasonable interpolation.
