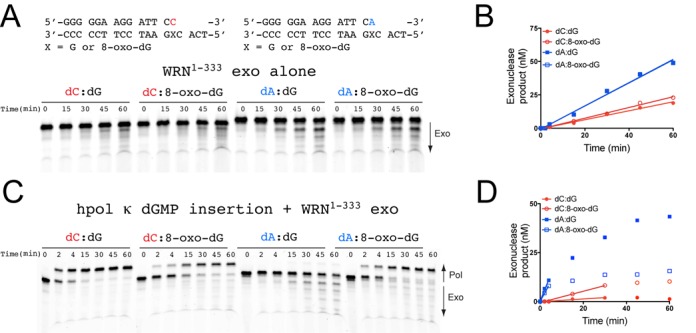
Figure 4.

The WRN exonuclease domain preferentially degrades dA:8-oxo-dG mis-pairs. (A) WRN exo (100 nM) activity was measured for 14/18-mer DNA substrates (200 nM) possessing the terminal bp indicated above the gel image. (B) WRN-catalyzed exonucleolytic degradation of primer was quantified and plotted as a function of time. The sum of all degraded product bands was quantified. The data were analyzed by linear regression to estimate the rate of primer degradation for the linear portion of the velocity curve: dC:dG (closed circles): vobs = 0.33 ± 0.02 nM min−1; dC:8-oxo-dG (open circles): vobs = 0.40 ± 0.01 nM min−1; dA:dG (closed squares): vobs = 0.87 ± 0.04 nM min−1; dA:8-oxo-dG (open squares): vobs = 0.86 ± 0.03 nM min−1. (C) hpol κ (2 nM) extension from 14/18-mer DNA substrates (200 nM) in the presence of WRN exo (100 nM). The reaction was initiated upon addition of dGTP (100 μM) and MgCl2 (5 mM). (D) WRN-catalyzed exonucleolytic degradation of primer in the presence of competing pol activity was quantified and plotted as a function of time. Both pol and exo product bands were quantified and the amount of degraded primer calculated as a fraction of the total DNA in each lane. The data were analyzed by linear regression to estimate the rate of primer degradation for the linear portion of the velocity curve: dC:dG (closed circles): vobs = 0.069 ± 0.009 nM min−1; dC:8-oxo-dG (open circles): vobs = 0.29 ± 0.02 nM min−1; dA:dG (closed squares): vobs = 2.7 ± 0.3 nM min−1; dA:8-oxo-dG (open squares): vobs = 2.0 ± 0.1 nM min−1.
