Figure 4.

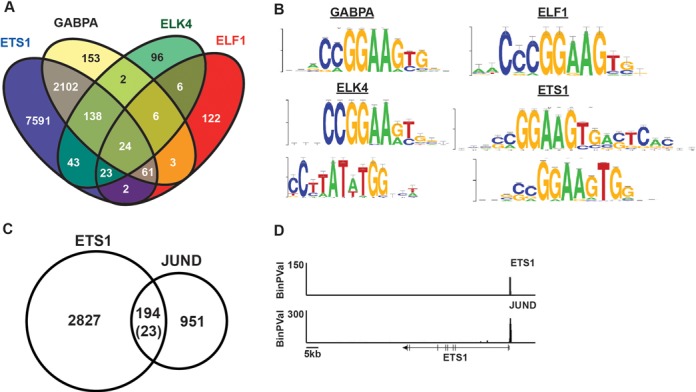
ETS1 binds ETS/AP1 sequences in vivo. (A) Venn diagram demonstrates overlap of all ChIP-seq bound regions in DU145 cells for ETS factors tested using Useq platform. (B) Most enriched motifs for bound enhancer regions (>300 bp from a TSS) as determined by RSAT peak-motifs algorithm after GEM analysis. For GABPA and ELF1, only one motif was identified. (C) Overlap of ETS1 bound enhancer regions with JUND bound regions in DU145 as determined by ChIP-seq analysis. Number in parenthesis indicates the number of expected overlaps using the assumption that any region of open chromatin is potential binding site (determined by RWPE1 DNase-seq). (D) ETS1 and JUND occupancy is plotted by -log binary P-value near the ETS1 gene.
