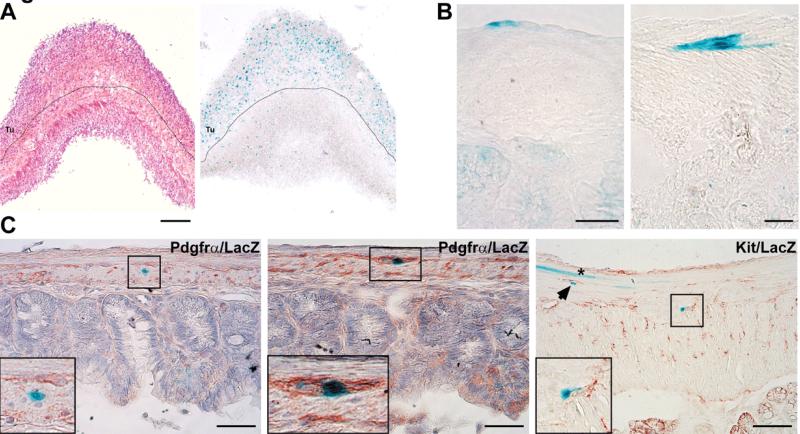
Figure 3. Lineage tracing identifies LysM-expressing cells in tumors of Ptch mutant mice and in the normal intestine, where they may co-express Pdgfra.
(A) The figure shows LacZ expression (blue color) in tumors of Ptchflox/floxLysMcre+/−R26R-LacZ+/− mice. Since LacZ expression in Ptchflox/floxLysMcre+/−R26R-LacZ+/− mice mark LysM-expressing cells, tumors are likely derived from LysM-positive cells. Dotted line marks the tumor (Tu)/normal muscle border. Left: H&E staining, Right: LacZ staining. (B) and (C) show LacZ-staining in normal intestine of LysMcre+/−R26R-LacZ+/− mice. Positive cells are detected between the longitudinal muscle layer and the serosa (B, left panel), the circular and longitudinal muscle layer (B, right panel) and within the muscle layer (C, left and right panels). Sections in (C) were co-stained with antibodies against Pdgfrα (left and middle panel) or Kit (right panel). Inset in the left panel shows a LacZ-positive, but Pdgfrα-negative cell. Inset in the middle panel shows a LacZ/Pdgfrα double-positive cell. Inset in the right panel shows a LacZ-positive cell juxtaposed to a Kit-positive cell (a similar cell is marked by an arrowhead). Please also note the LacZ-positive muscle fiber (asterisk, right panel) not juxtaposed to Kit-positive cells. Scale bars in μm: (A) 500; (B) 25; (C, left and middle panel) 50; (C, right panel) 25.

