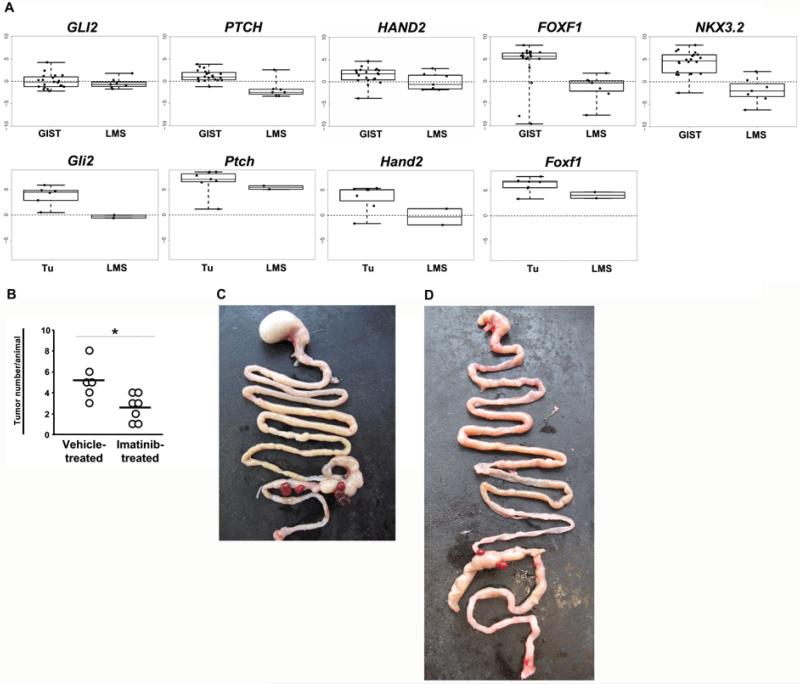
Figure 5. Differentiation of the tumors from LMS and responsiveness to imatinib.
(A) qRT-PCR analysis of Hh-target genes in 20 human GISTs compared to 7 human LMS samples (upper panel), and in tumors of Ptchflox/floxLysMcre+/− mice (Tu) compared to murine LMS derived from mice harboring a Pten/p53 mutation (lower panel). Expression levels in human and murine samples were normalized to the expression of β-actin and 18S rRNA, respectively. Data shows Box-Whisker-Plots of the relative gene expression. (B) Shown is the mean tumor number per animal for Ptchflox/floxLysMcre+/− mice after treatment with imatinib or with vehicle control (the asterisk indicates p<0.05 by unpaired t-test). Due to frequent clustering of tumor nodules (see Fig. 1A and 1E), each cluster was counted as one separate tumor. (C) shows the intestine of a vehicle-treated and (D) of an imatinib-treated animal.

