
Figure 9.
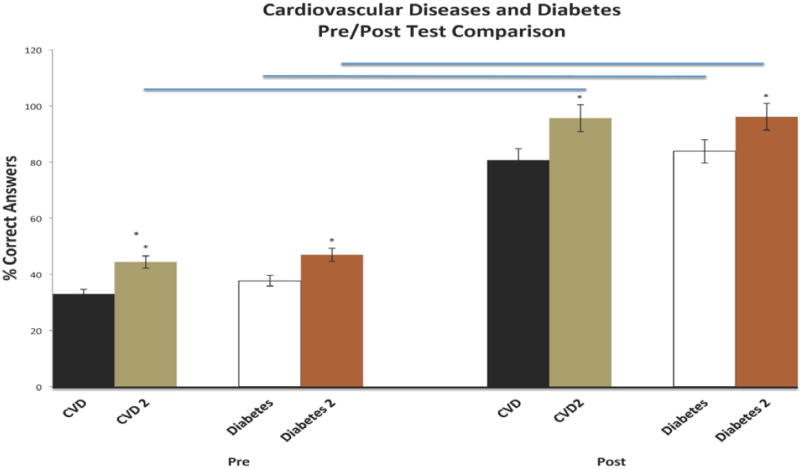
Pre-Post Testing Comparisons in the Areas of Cardiovascular Disease and Diabetes Over a Nine Month Interval Period of Educational Intervention. Asterisks denote significant differences in performance between first and second intervention, while bars denote significant differences between pre- and post-testing performance.