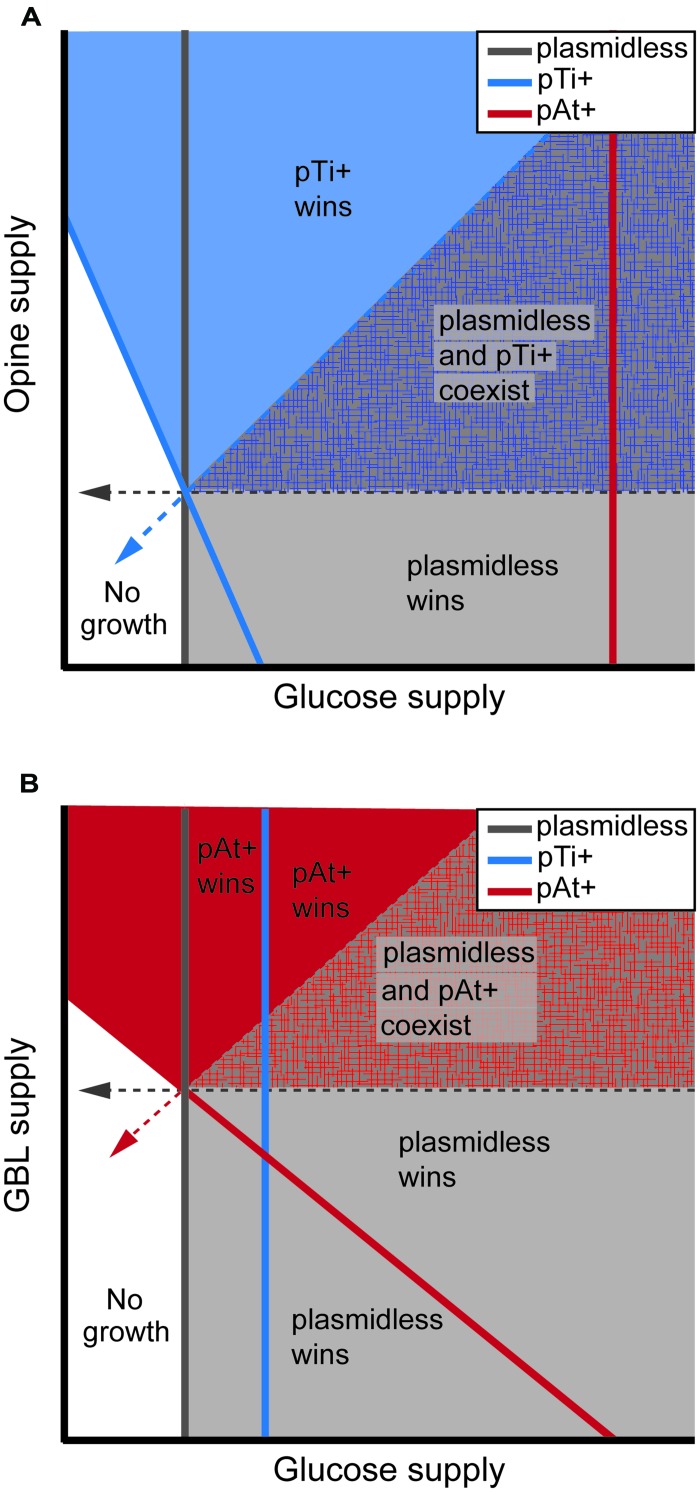
FIGURE 1.
Model predictions for the outcome of resource competition between plasmidless, Ti plasmid bearing, and At plasmid bearing agrobacteria for opines and glucose (A) and for γ-butyrolactone (GBL) and glucose (B). Solid lines represent the minimum resource levels required for growth, while dashed arrows represent the consumption vectors of the indicated strain. Plasmidless agrobacteria can catabolize glucose while pTi+ cells can catabolize both glucose and opines and pAt+ cells can catabolize both GBL and glucose. Because At plasmids are likely much more costly than Ti plasmids, the minimum amount of glucose needed to support a population of pAt+ cells is considerably greater than that of Ti+ cells (compare the x-intercepts of the zero-net-growth-isoclines of these strains). Zones of each phase plane are shaded according to which genotype or genotypes are able to persist in the corresponding environments despite resource competition with the other strains. Note that the lower left zone of each phase plane represents environments in which resource levels are too low to support growth of any of the genotypes. See Morton et al. (2014) for a more thorough model analysis that includes competition by genotypes bearing both a Ti plasmid and an At plasmid and Platt et al. (2012b) for an analysis of competition of genotypes bearing a Ti plasmid and avirulent, freeloading strains whose plasmids only contain the opine catabolism genes.

