
Figure 5.
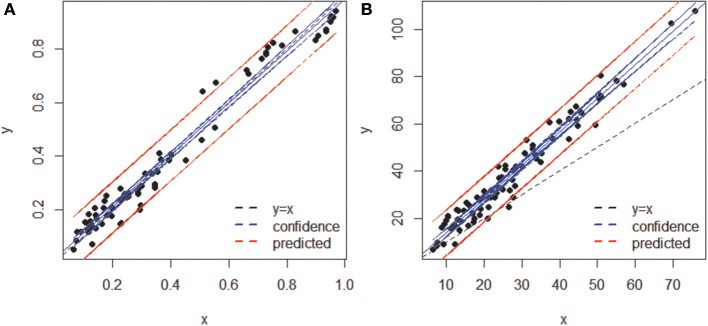
Comparison of sample dissimilarities obtained by MED (y axis) and of those obtained by OP (x axis) (A) using an asymmetric (Bray-Curtis) dissimilarity coefficient, (B) using a symmetric (Euclidean) coefficient. Notice the departure from the 1:1 line due to the inclusion of rare OTs in (B). The blue and red lines represent confidence (95%) and prediction lines, respectively, of the linear regression models.