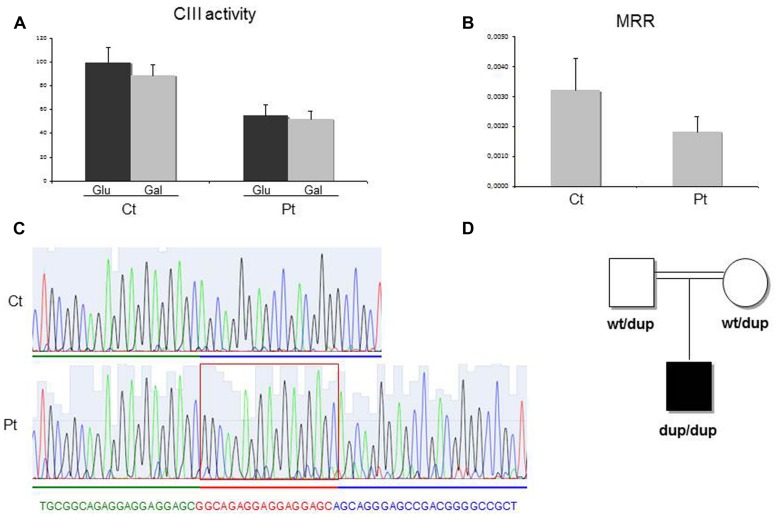
FIGURE 2.
Biochemical and genetic studies. (A) Complex III (cIII) activity in patient (Pt) and control (Ct) fibroblasts grown in either glucose-rich or in 5 mM galactose, glucose free medium for 48 h. The specific activities were normalized for citrate synthase activity. Bars represent SD. Pt vs Ct: p < 0.005 (in glucose), p < 0.001 (in galactose). The p-values were obtained by unpaired, two-tail Student’s test. (B) Maximal respiration rate (MRR) measurements performed in Pt and Ct fibroblasts, grown in glucose medium. MRR values are expressed as pMolesO2/min/cells. Bars represent SD. Pt vs Ct: p < 0.001 (p-value obtained by unpaired, two tail Student’s t-test). (C) Electropherogram of the TTC19 genomic region including the homozygous 17bp duplication (c.213_229dup) in the patient (Pt, lower panel) and in a control subject (Ct, upper panel). (D) Pedigree of the family. dup: allele harboring the c.213_229duplication; wt: allele harboring the wild-type TTC19 sequence.

