
Figure 2.
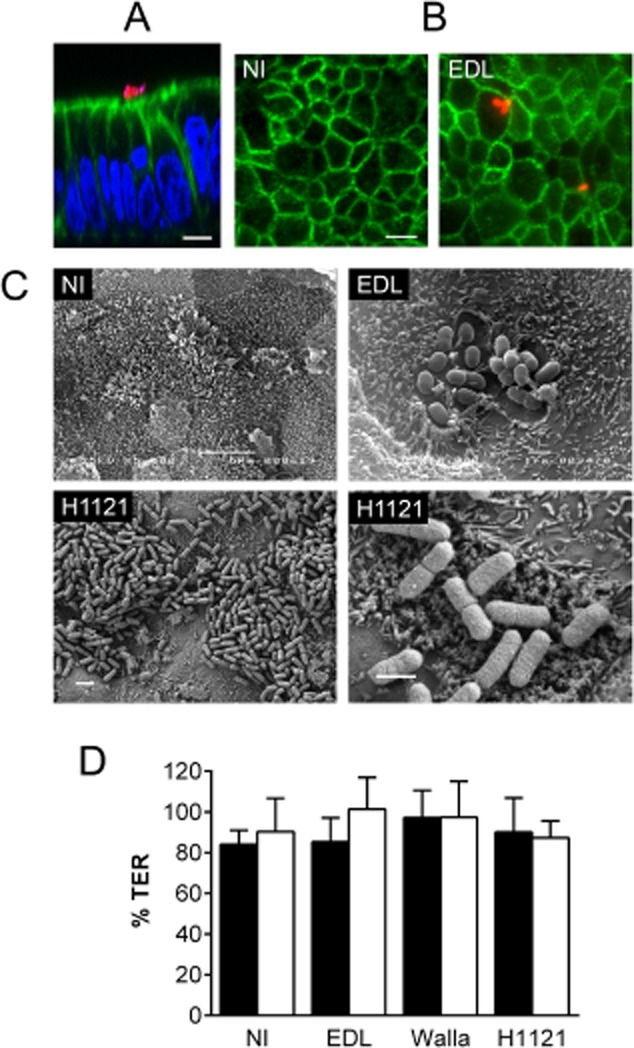
T84 cell integrity and STEC adherence after 5 h infection. Shown are representative images from two independent experiments performed in duplicate (A–C).
A. Confocal XZ scan of T84 cells infected with EDL933. Cell monolayers were stained for E. coli (red), F-actin (green) and cell nuclei (blue). Bar = 5 μm.
B. Immunofluorescence staining of non-infected (NI) and EDL933-infected T84 cells. Cells were stained for occludin (green) and E. coli (red). Bar = 10 μm.
C. Scanning electron micrographs of non-infected T84 cells (NI) and cells infected with EDL933 or H1121. Bars = 5 μm (NI), 2 μm (H1121, left panel) and 1 μm (EDL933; H1121, right panel).
D. TER of non-infected T84 cells (NI) and cells infected with EDL933, Walla-1 or H1121 under AE (■) or MA (□) conditions. TER after infection is expressed as percentage of TER before infection. Data are shown as means ± SEM from seven independent experiments performed in duplicate.