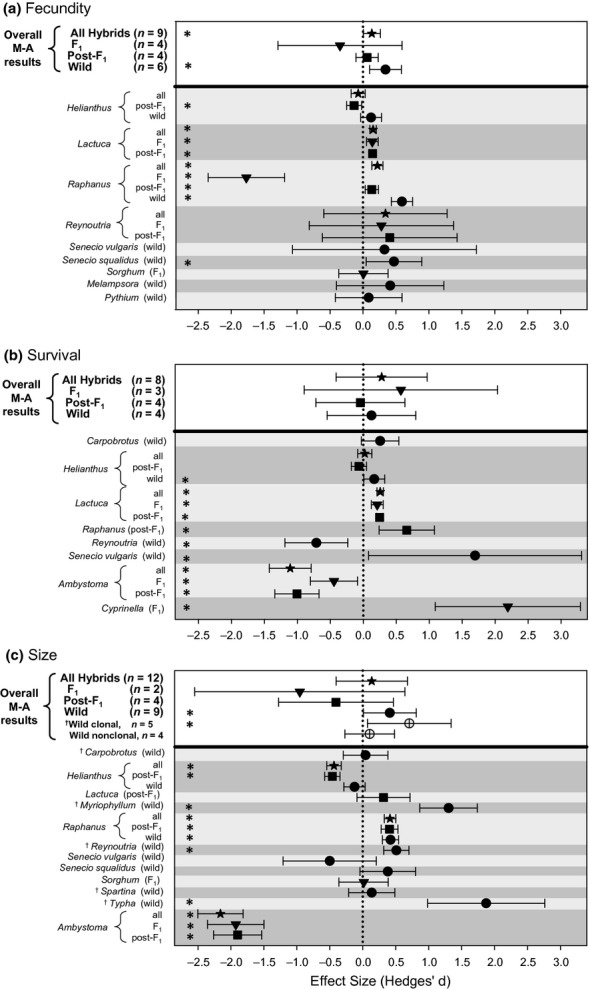
Figure 1.

Meta-analysis results, showing effect sizes and 95% confidence intervals for hybrid vs. parental performance for (a) fecundity, (b) survival and (c) size. Effects greater than zero (dotted vertical line) indicate greater hybrid performance relative to their ‘more invasive’ parental taxon. Confidence intervals excluding zero are noted with an asterisk along the left side of the panel. Overall effect sizes shown in the non-shaded region at the top of each panel are from random effect meta-analyses conducted separately for (1) all hybrid classes combined, (2) resynthesised F1 hybrids, (3) resynthesised post-F1 hybrids and (4) wild hybrids. In panel C, separate overall effect sizes are also shown for wild hybrids that are capable vs. incapable of clonal growth. Individual effect sizes are shown beneath the solid horizontal line, with taxa separated by alternate shading and symbols indicating different hybrid classes.
