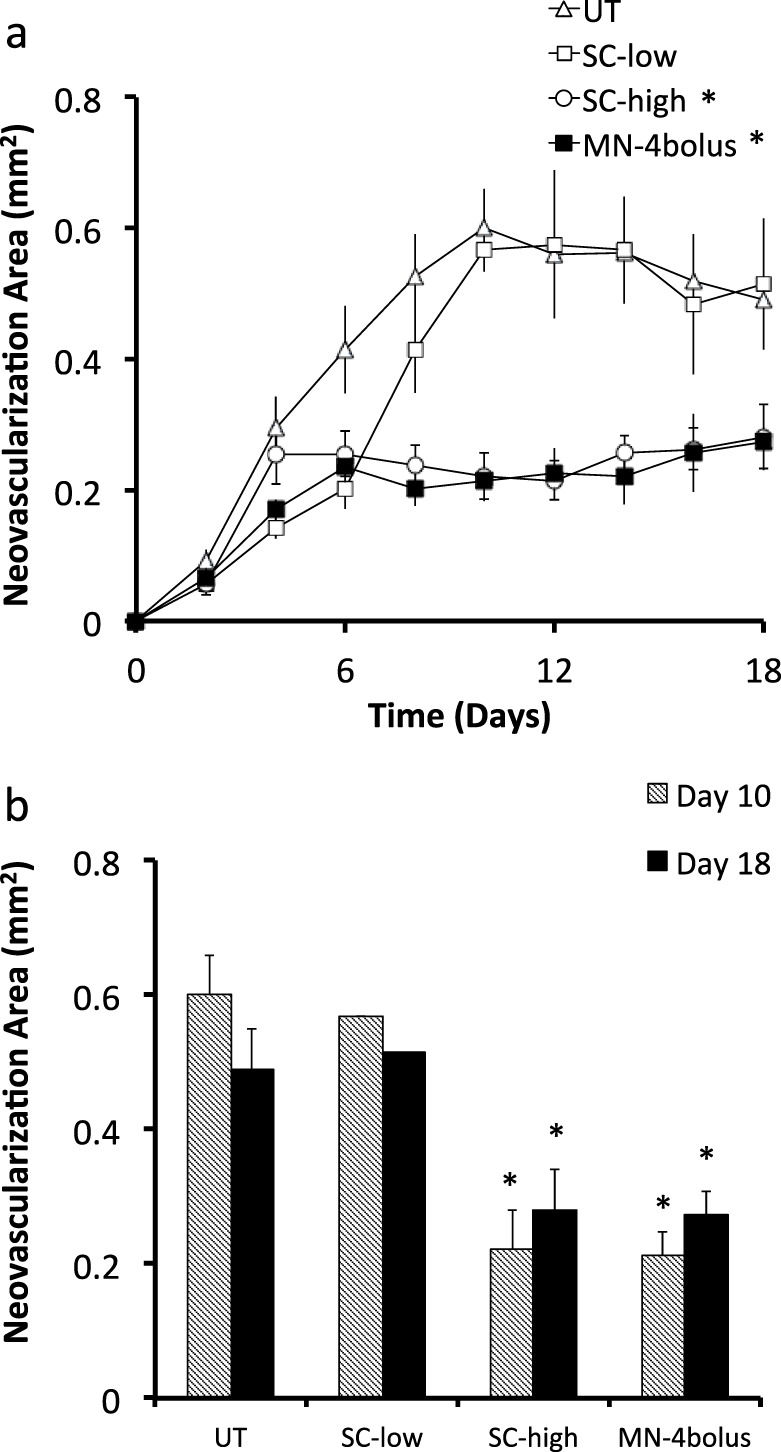
Figure 6.

Quantification of corneal neovascularization after suture-induced injury and treatment with bevacizumab by subconjunctival and intrastromal routes. (a) Neovascularization area versus time and (b) comparison between neovascularization area at days 10 and 18 for four treatment groups: Ut, Sc-low, Sc-high, and Mn-4 bolus. * Indicates a significant difference compared with the untreated group (P < 0.05). Data show average neovascularization area (mm2) ± SEM (n = 5 to 6 replicates).
