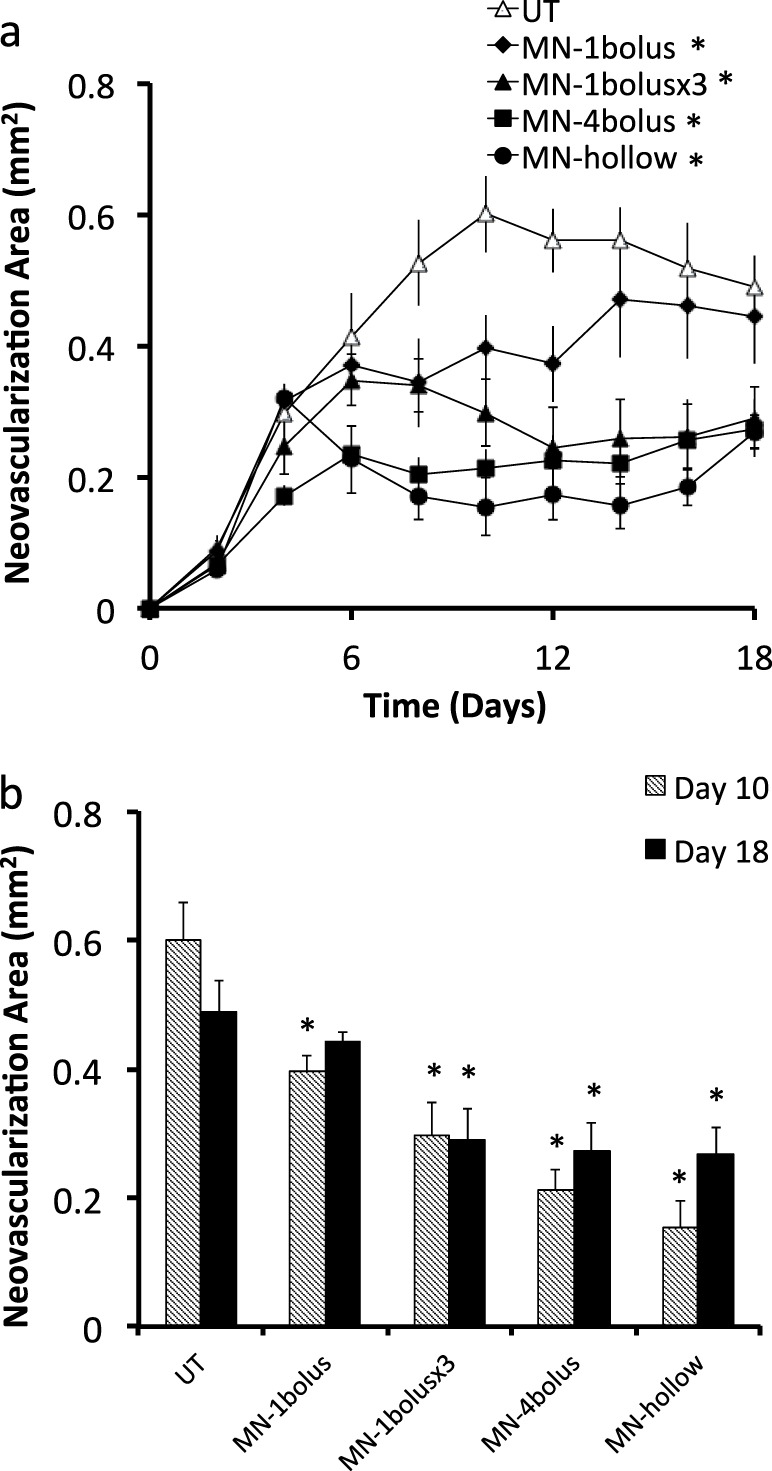
Figure 7.

Quantification of corneal neovascularization after suture-induced injury and treatment with bevacizumab as a function of dose by intrastromal routes. (a) Neovascularization area versus time and (b) comparison between neovascularization area at days 10 and 18 for five treatment groups: Ut and Mn-1 bolus on day 4; Mn-1 bolus ×3 on days 4, 6, and 8; Mn-4 bolus on day 4; and 50 μg on day 4 (Mn-hollow). * Indicates a significant difference compared with the untreated group (P < 0.05). Data show average neovascularization area (mm2) ± SEM (n = 4–6 replicates).
