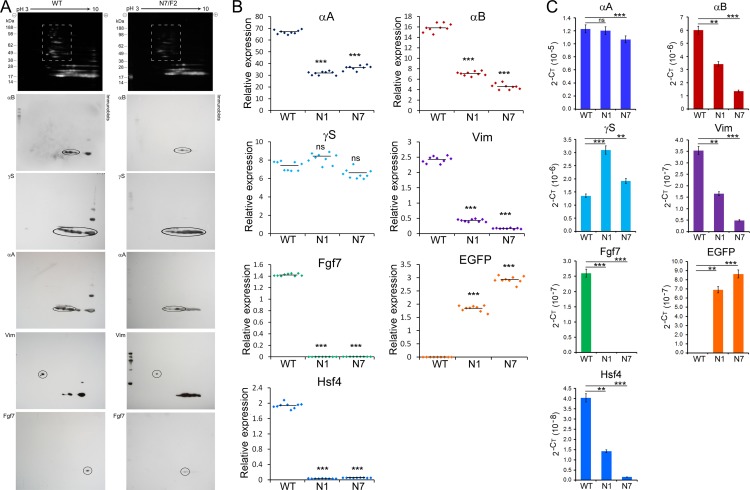
Figure 7.
Expression of crystallins, vimentin, and Fgf7 in PND02 transgenic lens. (A) The top shows Flamingo-stained fluorescent gels with standards (KDa). Note loss of higher molecular weight proteins (dotted box) in N7/F2. In the lower parts antibody reactions have been circled. One immunoblot was used with repeated stripping. The background reactions, when seen, are mostly gray/black reactivities. Anti-γS cross reacts with γ-crystallins in the WT as well as in N7/F2 blots. Note appreciable decreases in αB and αA, and also in vimentin (Vim) and Fgf7. (B) RT–qPCR analysis of WT, N1/F2, and N7/F2 PND02 RNA presented as relative gene expression using Gapdh as the internal control. Raw data points (normalized, 2−ΔΔCT) are shown in dot plots. The means are indicated by a horizontal black line across the points. These data corroborate what is seen in the 2D-gels. (C) RT-qPCR data, presented in (B) were analyzed without normalization and presented in bar graphs (a 2−CT plot60). Note these data show changes in the transcript levels of γS. The hybrid Hsf4 (DBD)-EGFP transcripts were detected using EGFP-specific primers. The data represent three experimental replicates from three independent biological samples. ***P < 0.001 and *P < 0.01 were considered to be statistically significant. ns, not significant.

