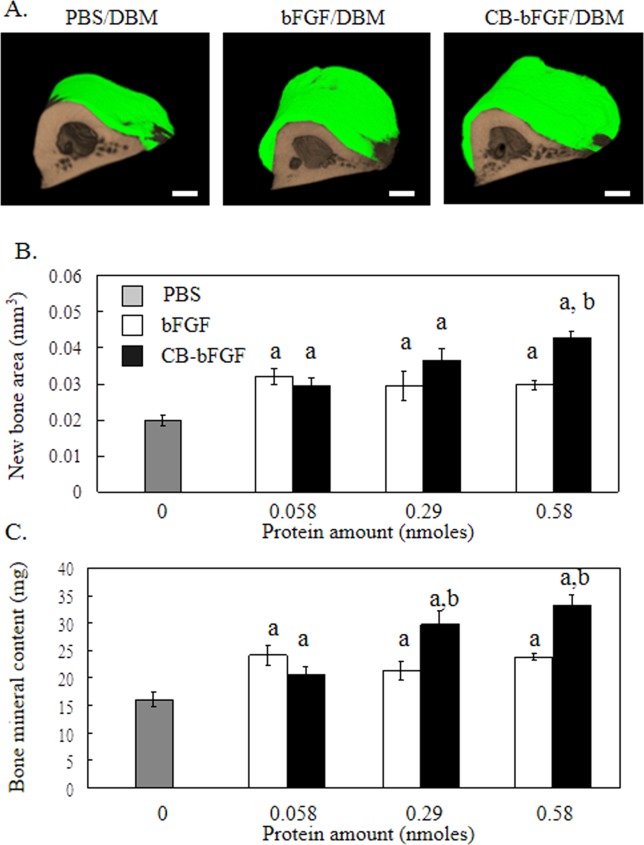
Figure 4.

3D micro-CT analysis of rat femurs two weeks after grafting DBM loaded with CB-bFGF. A: 3D micro-CT image, A-1: PBS, A-2: 0.58 nmol bFGF, A-3: 0.58 nmol CB-bFGF. Green color: new bone; brown color: existing bone. The scale bars indicate 1 mm. B: New bone area, and C: Bone mineral content after grafting DBM with various amounts of either bFGF or CB-bFGF. Data are presented as the mean ± S.E. (n = 8). a: p < 0.05 compared with the control group. b: p < 0.05 compared with the dose-matched group. [Color figure can be viewed in the online issue, which is available at wileyonlinelibrary.com.]
