
Figure 1.
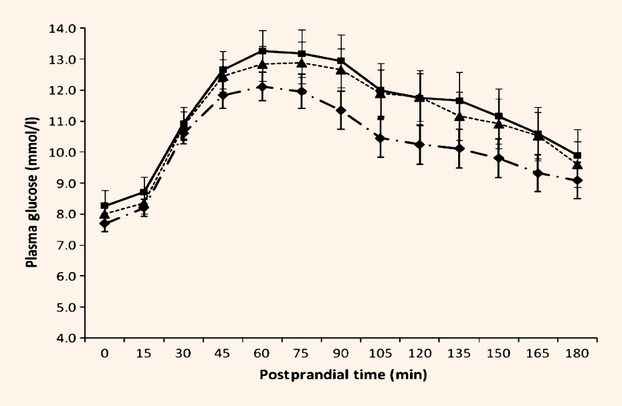
Glycaemic response to standard test meal at baseline and following dietary intervention. Values are means. Habitual (pre-intervention) ( ); standard dietary advice (
 ); oat-enriched diet (
 ). Effect of time, P < 0.001. Effect of diet, P = 0.036. Interaction between postprandial time × diet, P < 0.001.