Figure 1.
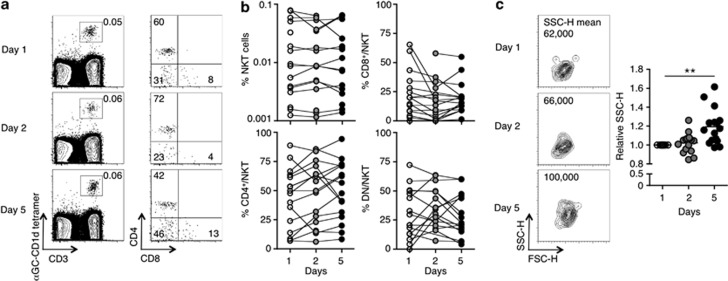
Natural killer T (NKT) cell frequency and CD4 expression in the peripheral blood remain stable following rIL-21 administration. Blood samples from patients receiving rIL-21 were collected on days 1, 2, and 5 and analyzed for NKT cells (α-GC/CD1d tetramer+ CD3+) and CD4 and CD8 expression on NKT cells. (a) Contour and dot plots of peripheral blood NKT cells (left-hand column) and CD4 vs. CD8 expression (middle) on gated NKT cells from one patient. Numbers depict the percentage of cells in the gate/quadrant. (b) The percentage of NKT cells among total lymphocytes and the percentage of CD4+CD8−, CD4−CD8+, and CD4−CD8− (DN) cells among gated NKT cells is depicted over time in patients receiving rIL-21. (c) Contour plots of Forward scatter-height (FSC-H) vs. Side scatter-height (SSC-H) on gated NKT cells from one patient over time. Numbers depict the mean fluorescence intensity (MFI) of SSC-H. The graph shows the relative MFI of SSC-H on gated peripheral blood NKT cells from patients receiving rIL-21. Results were analyzed using the Wilcoxon signed rank test on the raw data with a Bonferroni correction to account for the number of comparisons being made (**P<0.01).

