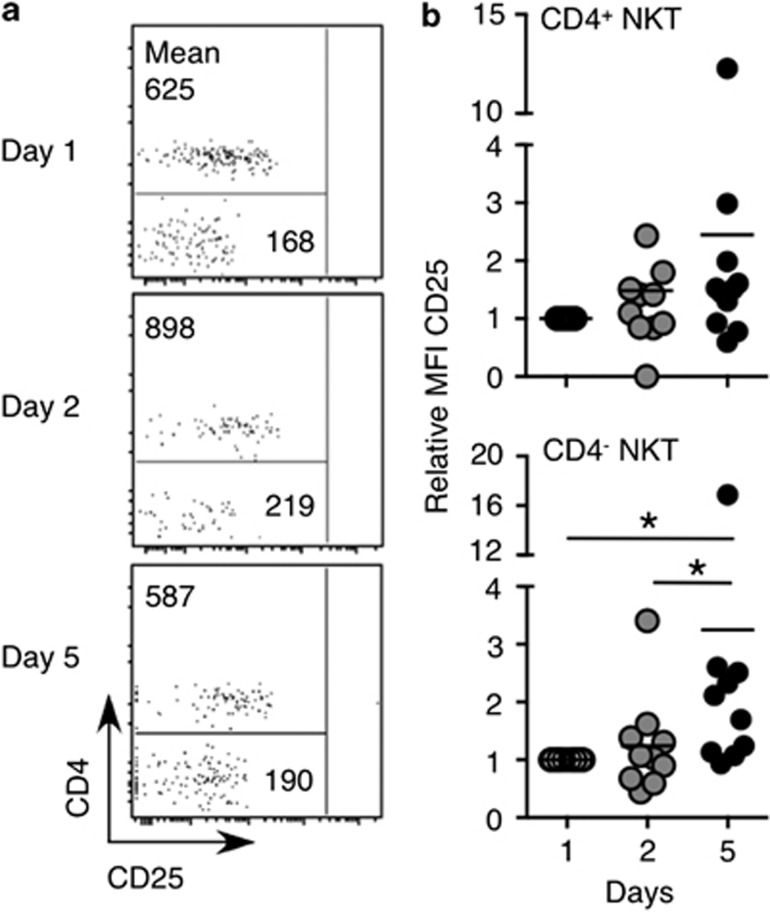
Figure 2.
CD25 expression on CD4+ and CD4− natural killer T (NKT) cells following rIL-21 administration. Blood samples were collected and CD25 expression was analyzed on gated NKT cells. (a) Dot plots of gated NKT cells from one patient depicting CD25 vs. CD4 expression. Numbers show the MFI of cells in the gated region. (b) The relative MFI of CD25 expression on gated peripheral blood CD4+ and CD4− NKT cells from patients receiving rIL-21. Note that for some patients, NKT cell proportions were too low to reliably depict CD25 expression, and hence, these patients were omitted from the analysis. Results were analyzed using the Wilcoxon signed rank test on the raw data with a Bonferroni correction to account for the number of comparisons being made (*P<0.05).

