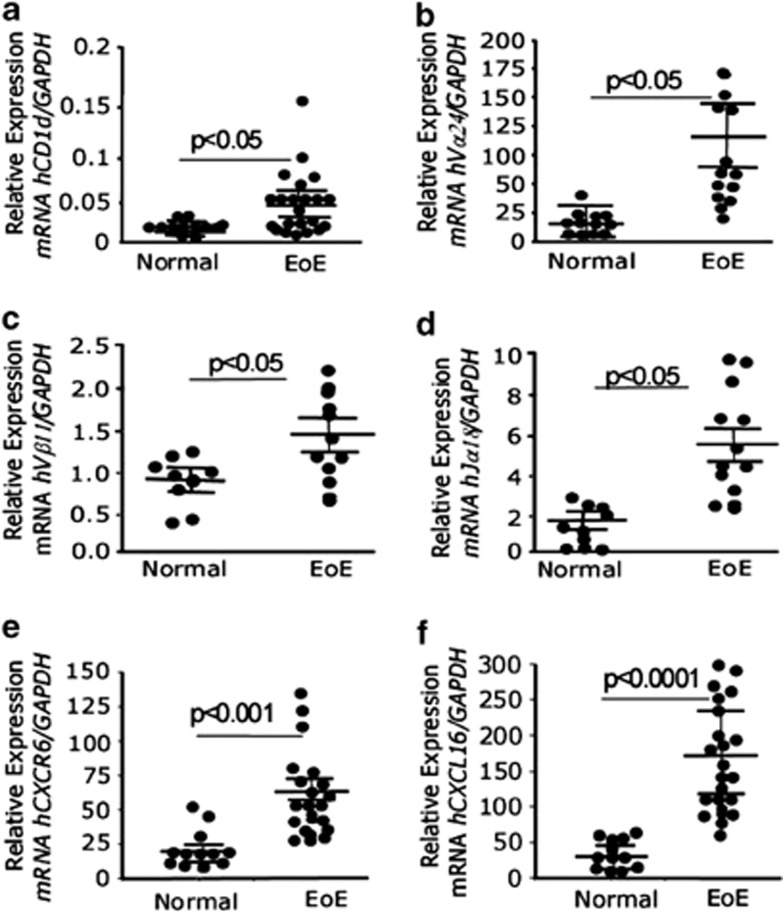
Figure 3.
Analysis of iNKT cell-specific genes in human esophageal biopsies. The mRNA levels of iNKT cell surface molecule, TCR and T-cell components like CD1d (a), Vα24 (b), Vβ11 (c), Jα18, (d), CXCR6 (e) and chemokine CXCL16 (f) were examined by performing quantitative real-time PCR analysis. Each data point represents an individual patient (n=12–15 normal and 24–28 in EoE). The mRNA expression was normalized to GAPDH and expressed as relative expression. Statistical significance was calculated using the Mann–Whitney test. P-values for each experiment are provided in the figure (a–f).

