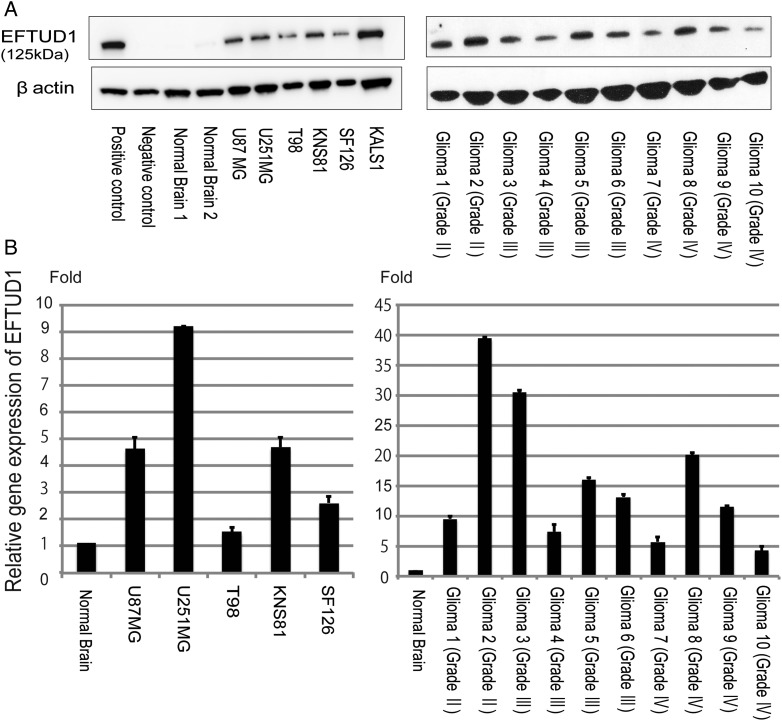
Fig. 1.
High expression of EFTUD1 in glioma cell lines and tissue. (A) Western blot analysis of EFTUD1 expression in a positive control, a negative control, 2 normal brain tissues, 6 glioma cell lines (U87MG, U251MG, T98G, KNS81, SF126, and KALS-1), and 10 glioma tissues. Cell lysate of COS-7 cells transfected with pcDNA3myc/EFTUD1 was prepared as a positive control, and COS-7 cells were prepared as a negative control. β-actin loading controls from the same blots are shown in the lower panels. (B) Quantitative PCR analysis of the EFTUD1 gene in glioma cell lines and tissue compared with normal brain tissue. The same glioma cells and tissue samples as Western blot analysis were investigated. Relative EFTUD1 expression level was normalized to GAPDH level in each sample and calculated as the threshold cycle (CT) value in each sample divided by the CT value in the normal brain. Mean ± S.D. (bars) for at least 3 independent experiments are shown.

