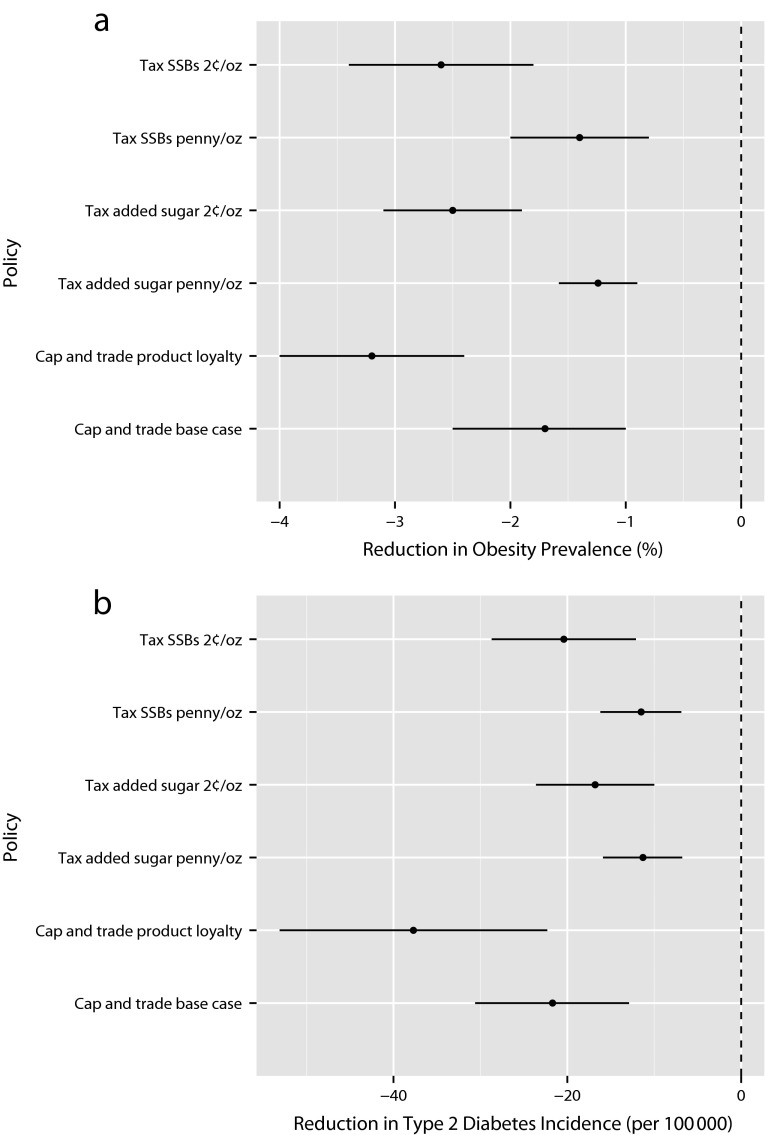
FIGURE 3—
Sensitivity analyses comparing the effect of 3 added-sugar-reduction policies over a 20-year policy-planning horizon on (a) obesity prevalence and (b) type 2 diabetes incidence.
Note. SSB = sugar-sweetened beverage. In our “base case” simulation of a cap-and-trade policy, we conservatively simulated consumers as switching from their preferred product to the product with the closest added-sugar content within the food category when their preferred product was reformulated to meet the added sugar cap. We compared this scenario to a less pessimistic “product loyalty” simulation in which consumers continue to consume their preferred food product after reformulation of the product to a lower-sugar version. We compared these cap-and-trade policy scenarios with both the sugar-SSB and added-sugar tax policies, varying the level of the tax from a penny per ounce to 2 cents per ounce. Further sensitivity analyses, including details of policy effects among different demographic groups given differences in obesity and type 2 diabetes rates and consumption behaviors, are provided in the Appendix (available as a supplement to the online version of this article at http://www.ajph.org). In each comparative effectiveness analysis, the policy outcomes are compared with the counterfactual case in which the policy is not introduced, accounting for secular trends in consumption and disease risk in the population over a 20-year policy-planning horizon.

