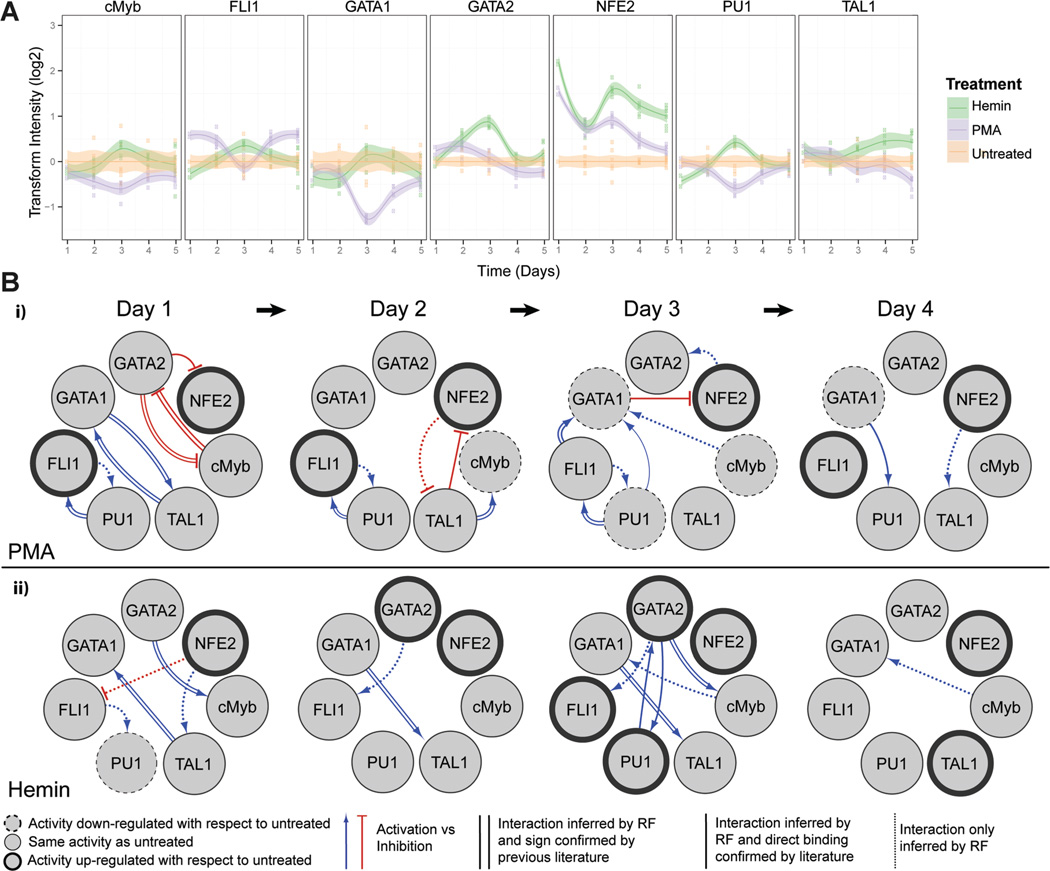
Figure 2.
Dynamic TF activity array and regulatory networks of K562 cells during MK or E differentiation. A: K562 cells transduced by each TF-activity-reporting lentivirus were treated with 10ng/mL of PMA or 30µM of hemin. TF activity was normalized by TA activity and represented by the ratio to vehicle-treated cells. Shaded regions denote 95% confidence intervals about the mean of six measurements (indicated by data points) from two independent transduction experiments. B: The dynamic TF regulatory networks for PMA- and hemin-treated K562 cells inferred from TF array data. The TF network shows target and regulator TFs (circles), as well as putative direct or indirect interactions between TFs (directed arrows). TF nodes (circles) indicate if TF activity is upregulated (bold outline), downregulated (dashed outline), or unchanged (thin outline) with respect to untreated control on the indicated day. Edge line styles depict whether the inferred interaction is a direct interaction confirmed by previous literature found in GENEGO (parallel lines), a direct interaction confirmed by previous literature but activation (blue lines) or inhibition (red lines) of the target is unknown (solid lines), or inferred interaction is novel (dotted lines).

